Gold Price Forecast: XAU/USD is firm in a risk-off market setting
- Gold flirts with the key Fibonacci retracement support after bulls stepped back from yearly resistance.
- Pre-Fed caution, Omicron woes join geopolitics to challenge gold buyers, downbeat yields defend bulls.
- January PMIs, US Q4 GDP may entertain traders but FOMC will be crucial as traders await clues of March rate hike.
- Gold Weekly Forecast: XAU/USD could turn south on a hawkish Fed surprise
Update: Gold (XAU/USD) is firm within a risk-off environment with Asian share markets slipping on Monday while investors note that the Federal Reserve expected to confirm it will soon start draining the massive liquidity that has fulled stock markets for years. Additionally, a Russian attack on Ukraine is a growing risk as per weekend headlines.
-
US orders families of all American embassy staff in Kyiv to leave Ukraine
-
Russia/Ukraine tensions rising: British gov says it has uncovered a plot by Moscow to install a pro-Russian leader in Kiev
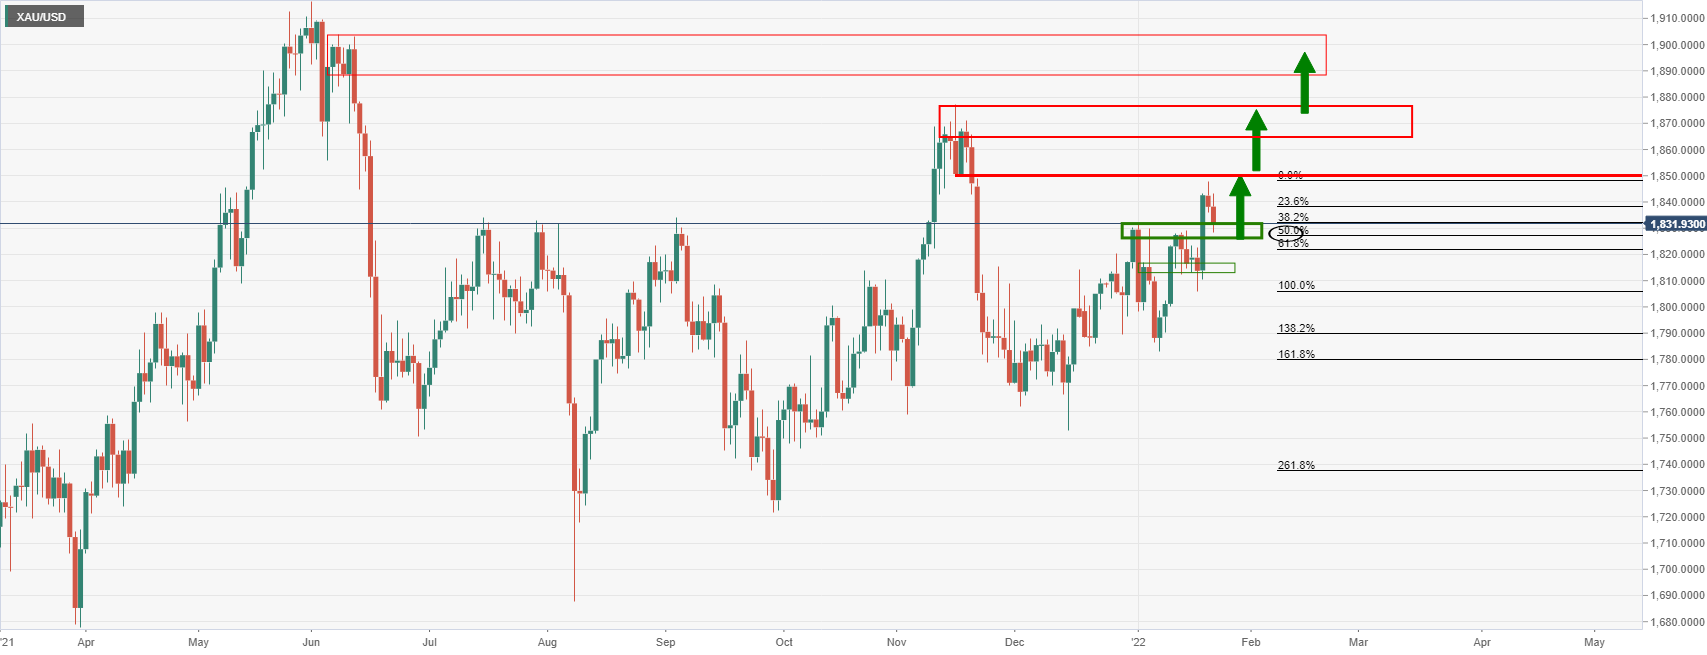
From a technical standpoint, the price has just made another 50% mean reversion on the daily chart:
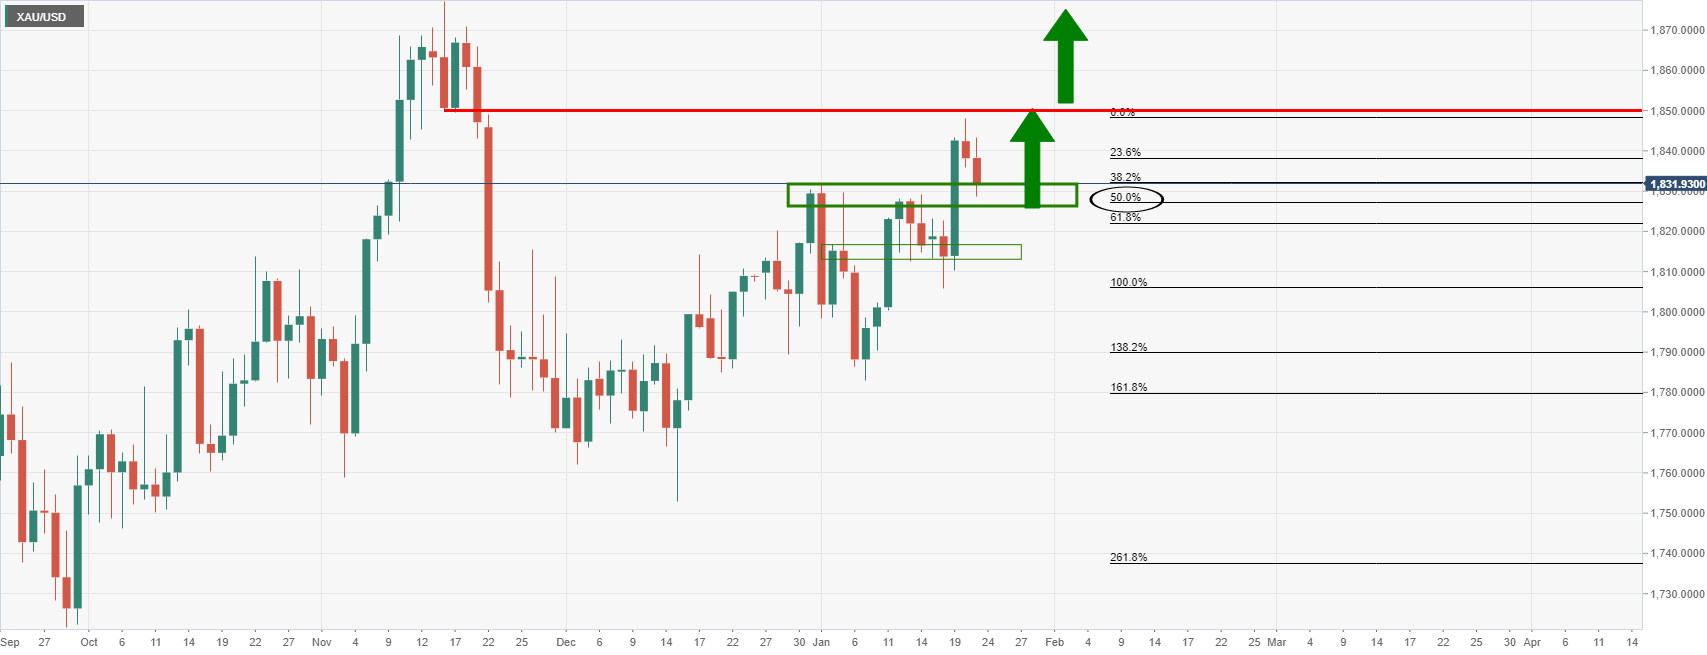
As per prior analysis made ahead of the open today, ''while some deceleration of the price's correction and sideways consolidation into the critical Fed event this week could be in order, should the support hold, then a burst through $1,850 would be expected to see the bulls in good stead towards the $1,870's as last major defence for the $1,900s''
End of update
Gold (XAU/USD) begins the Fed week on a slightly positive note around $1,834, following a two-week uptrend, during the initial Asian session on Monday.
Gold prices rose during the last two weeks before reversing from the yearly resistance line on Thursday.
That said, the market’s cautious sentiment ahead of this week’s crucial Federal Open Market Committee (FOMC) joined downbeat US Treasury yields and the US Dollar Index (DXY) performance to underpin the yellow metal’s safe-haven demand in the recent days. In addition to the Fed-linked fears, geopolitical concerns relating to the Ukraine-Russia war and Omicron chatters, not to forget inflation woes, also directed market players towards the traditional risk-safety.
Even as the last week’s US data was mostly mixed, the latest Fedspeak has been hawkish, suggesting that the US central bank is on the way to chart March’s rate hike on Wednesday. Adding to the bullish bias were the chatters concerning Omicron-linked supply chain damage and inflation woes. It’s worth noting that comments from US President Joe Biden and International Monetary Fund Managing Director Kristalina Georgieva were both in support of the Fed’s hawkish bias, which in turn reinforced Fed rate hike concerns.
“Markets have been trading cautiously ahead of this week’s FOMC statement, which is expected to be hawkish and potentially outline the case for interest rate rises starting in March. We are doubtful that the Fed will end QE next week, as some in the market speculate. We are also doubtful that the Fed would begin to tighten policy with a 50 bps rate rise. Markets may stabilize if the Fed is not as hawkish as some worst-case fears suggest,” said ANZ.
Elsewhere, the South African covid variant, namely Omicron, pushes more areas of Japan towards quasi emergency whereas New Zealand is also up for more activity controls, if not the complete lockdowns, due to the stated virus strain. Further, reports of Russia’s preparations to invade Ukraine also take rounds of late, which in turn keep gold in demand.
Against this backdrop, the US 10-year Treasury yields rose 1.8 basis points (bps) to 1.767%, after posting the first weekly decline in five, whereas the S&P 500 Futures rise 0.30% while licking the previous week’s wounds amid the mostly quiet session.
Moving on, preliminary readings of January PMIs will offer intraday directions to the gold traders. However, major attention will be given to Wednesday’s Fed meeting and Treasury yields.
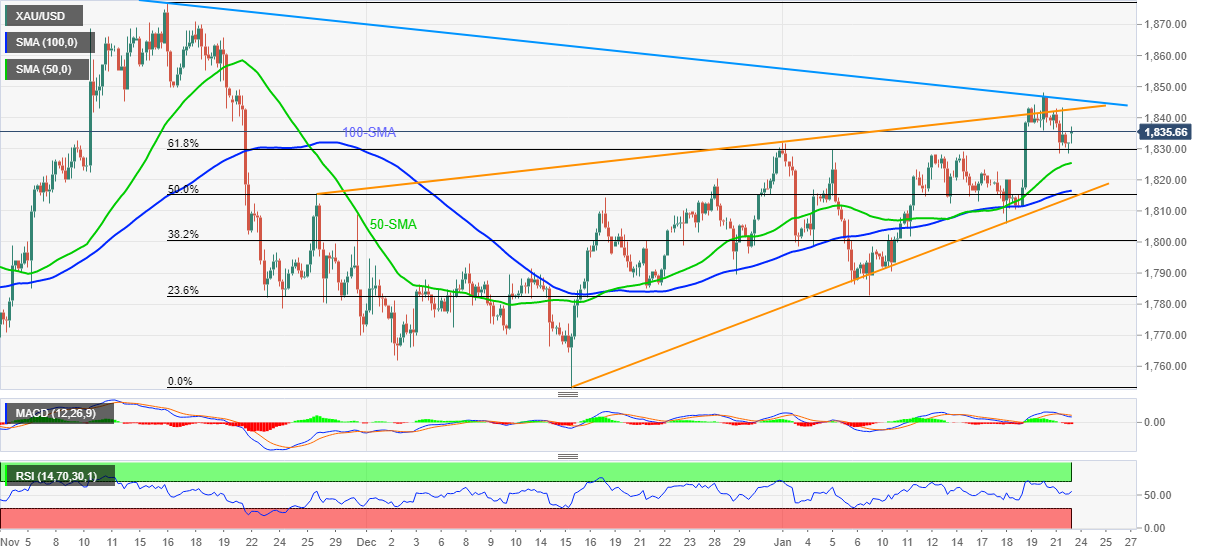
Technical analysis
Having reversed from a year-long resistance line, gold prices eye further losses towards 50 and 100-SMA levels, respectively around $1,825 and $1,816, currently poking 61.8% Fibonacci retracement (Fibo.) of November-December downside.
However, the metal’s further downside will be challenged by an ascending support line from mid-December 2021 near $1,812, a break of which will confirm rising wedge bearish chart formation.
Should bears keep reins past $1,812, theory suggests a gradual south-run towards September 2021 low surrounding $1,721. Though, the monthly bottom and December 2021 lows near $1,780 and $1,755 in that order will offer intermediate halts.
Alternatively, recovery moves will initially aim to defy the rising wedge formation by a clear upside break of the pattern’s resistance line, close to $1,842.
Following that, the previously mentioned yearly resistance line near $1,848 will regain the market’s attention as a break of which will be an open invitation for the bulls to aim for $1,900 and above during the days to come.
To sum up, gold buyers stepped back from the key resistance line but that doesn’t give a warm welcome to the sellers until the quote drops below $1,812.
Gold: Four-hour chart
Trend: Pullback expected
Author

Anil Panchal
FXStreet
Anil Panchal has nearly 15 years of experience in tracking financial markets. With a keen interest in macroeconomics, Anil aptly tracks global news/updates and stays well-informed about the global financial moves and their implications.


