Gold Price Forecast: XAU/USD rebound appears elusive amid mixed concerns over Fed, geopolitics
- Gold price prints mild gains around weekly low, snaps three-day downtrend.
- US Dollar traces a pullback in yields to pare weekly gains as inflation expectations ease.
- Fed Minutes, policymakers’ comments appear hawkish; China, US interference in Russia-Ukraine war escalates geopolitical fears.
- Second-tier US data eyed for fresh impulse ahead of Friday’s US Core PCE Inflation.

Gold price (XAU/USD) picks up bids to pare weekly losses around $1,827 during early Thursday morning in Europe. In doing so, the yellow metal prints the first daily gains in four amid the US Dollar pullback.
US Dollar Index (DXY) retreats from the weekly high, down 0.16% intraday to 104.35, as the US Treasury bond yields lack momentum during Japan’s holidays. Also allowing the DXY to pare recent gains is the pullback in the bond coupons from the multi-day high. That said, the US 10-year and two-year Treasury bond yields snapped a two-day uptrend the previous day before marking inaction around 3.92% and 4.70%.
Behind the moves could be the latest retreat in the US inflation expectations, per the 10-year and 5-year breakeven inflation rates from the St. Louis Federal Reserve (FRED), as both these gauges ease from their recent highs at the latest.
The inflation expectations gained major attention after Federal Open Market Committee’s (FOMC) Monetary Policy Meeting Minutes signaled that the policymakers discussed going easy on the rate hike trajectory if needed. However, the broad discussion on the need for more rate hikes and hawkish comments from St. Louis Federal Reserve President James Bullard, as well as from Federal Reserve Bank of New York President John Williams, challenge the dovish bias surrounding the Fed.
Elsewhere, US President Joe Biden’s comments could also be held responsible for the latest mildly upbeat sentiment and a corrective bounce in the Gold price. As per the latest commentary from US President Joe Biden, he thinks that his Russian counterpart isn’t up to using nuclear arms by backing off an international treaty. However, the fears surrounding the Ukraine-Russia war are far from over, with the latest edition of the West and China escalating the matter to the worse. That said, the Wall Street Journal (WSJ) recently said that the US is considering the release of intelligence on China’s potential arms transfer to Russia. Previously, the China-Russia ties seemed to have escalated the geopolitical woes as the US strongly criticized such moves and favored the rush towards risk safety.
Amid these plays, S&P 500 Futures bounced off the monthly low to print mild gains around 4,020.
Moving on, geopolitical headlines and second-tier data from the US will be important for fresh impulse ahead of Friday’s US Core Personal Consumption Expenditures (PCE) Price Index data, the Fed’s favorite inflation gauge.
Technical analysis
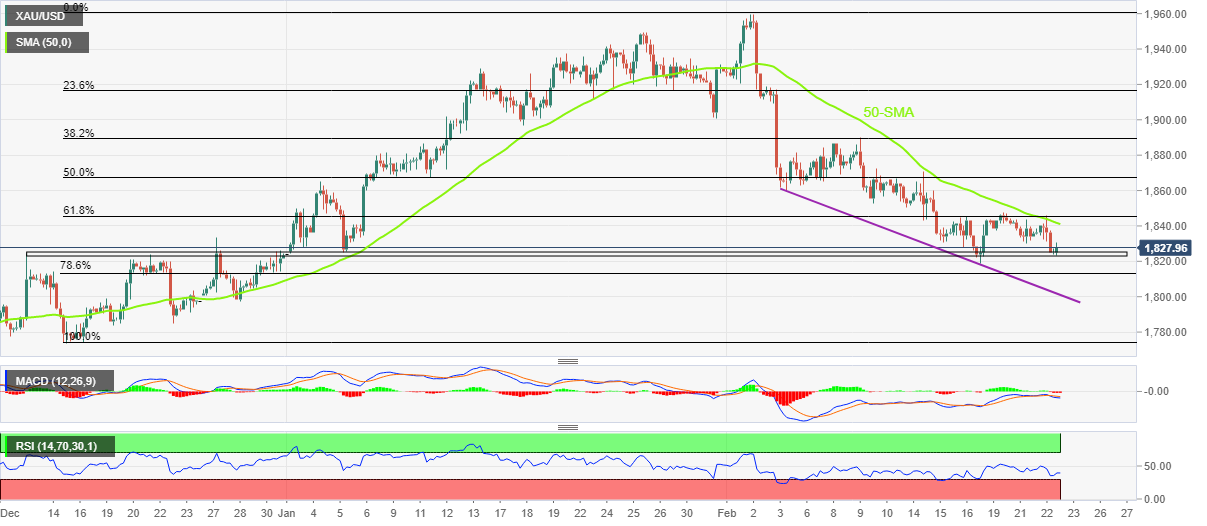
Gold price rebounds from a six-week-old horizontal support zone, around $1,825-23, amid an uptick of the RSI (14) line and sluggish MACD signals. However, the 50-Simple Moving Average (SMA) level surrounding $1,842, guards the immediate upside of the XAU/USD.
Following that, the 61.8% Fibonacci retracement level of the metal’s upside from mid-December 2022 to early February 2023, near $1,846, could test the recovery moves before directing them to February 09 swing high, also including 38.2% Fibonacci retracement, at $1,890.
It’s worth noting that the January 31 swing low of $1,901 could act as the last defense of the Gold sellers before directing them to the monthly peak surrounding $1,960.
Alternatively, a downside break of the $1,825-23 horizontal support could drag the Gold price towards the 78.6% Fibonacci retracement level of $1,813 and then to a three-week-old descending support line, close to $1,803.
In a case where the Gold price remains weak past $1,803, the $1,800 round figure may act as an additional downside filter.
Overall, the Gold price remains on the bear’s radar despite the recent rebound.
Gold price: Four-hour chart
Trend: Further downside expected
Author

Anil Panchal
FXStreet
Anil Panchal has nearly 15 years of experience in tracking financial markets. With a keen interest in macroeconomics, Anil aptly tracks global news/updates and stays well-informed about the global financial moves and their implications.


