- Gold price consolidates the upside before the next push higher.
- Gold remains undeterred by the global tightening calls after hot US inflation.
- Gold price turns bullish on falling bond yields, technical breakout.
With hot US inflation bringing back rate hike expectations on the table from the Fed and the ECB, gold price continues to benefit from its increased demand as an inflation hedge. Holiday-thinned market conditions are also boding well for the bright metal, as attention shifts towards Friday’s US Michigan Consumer Sentiment data. In the meantime, expectations of global tightening will continue to influence gold price.
Read: Gold Price Forecast: Will US inflation trigger a sustained move above $1,834 in XAU/USD?
Gold Price: Key levels to watch
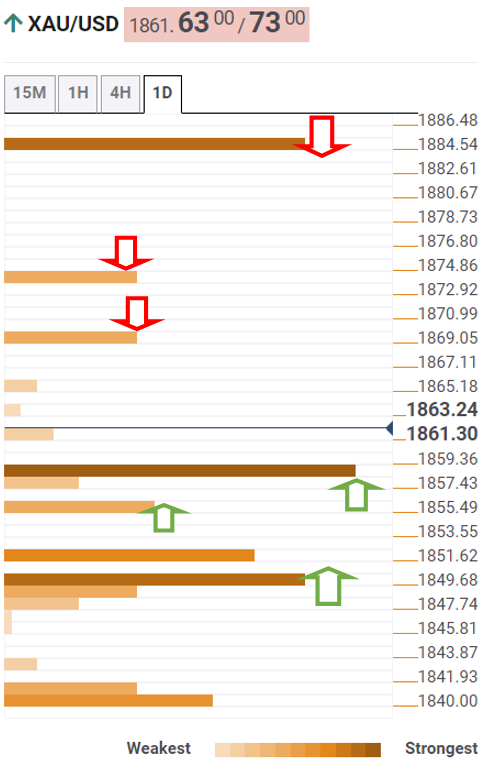
The Technical Confluences Detector shows that gold price needs acceptance above the previous day’s high of $1,869 to extend the bullish momentum towards the daily R1 pivot point, at $1,873.
A firm break above the latter will open doors towards $1,884, where the R3 monthly pivot point aligns.
Alternatively, if sellers manage to find a strong foothold below the confluence of the Fibonacci 23.6%, the daily pivot point and weekly R2 pivot at $1,859, the corrective pullback could gain traction.
The next downside target is seen at the previous hourly low at $1,855, below which fierce support around $1,850 will come into play.
That area is the intersection of the R2 monthly pivot point, the Fibonacci 38.2% level and the 5-4hr SMA.
Here is how it looks on the tool
About Technical Confluences Detector
The TCD (Technical Confluences Detector) is a tool to locate and point out those price levels where there is a congestion of indicators, moving averages, Fibonacci levels, Pivot Points, etc. If you are a short-term trader, you will find these useful entry points for counter-trend strategies, scalping a few points at a time. If you are a medium-to-long-term trader, this tool will give you advance notice of the price levels where a medium-to-long-term trend may stop and rest, as well as where to unwind positions, or where to increase your position size.
Information on these pages contains forward-looking statements that involve risks and uncertainties. Markets and instruments profiled on this page are for informational purposes only and should not in any way come across as a recommendation to buy or sell in these assets. You should do your own thorough research before making any investment decisions. FXStreet does not in any way guarantee that this information is free from mistakes, errors, or material misstatements. It also does not guarantee that this information is of a timely nature. Investing in Open Markets involves a great deal of risk, including the loss of all or a portion of your investment, as well as emotional distress. All risks, losses and costs associated with investing, including total loss of principal, are your responsibility. The views and opinions expressed in this article are those of the authors and do not necessarily reflect the official policy or position of FXStreet nor its advertisers. The author will not be held responsible for information that is found at the end of links posted on this page.
If not otherwise explicitly mentioned in the body of the article, at the time of writing, the author has no position in any stock mentioned in this article and no business relationship with any company mentioned. The author has not received compensation for writing this article, other than from FXStreet.
FXStreet and the author do not provide personalized recommendations. The author makes no representations as to the accuracy, completeness, or suitability of this information. FXStreet and the author will not be liable for any errors, omissions or any losses, injuries or damages arising from this information and its display or use. Errors and omissions excepted.
The author and FXStreet are not registered investment advisors and nothing in this article is intended to be investment advice.
Recommended content
Editors’ Picks

EUR/USD bounces off lows near 1.0820, Dollar loses traction
EUR/USD attempts some recovery following lows near 1.0820 as the US Dollar chalks up another strong day. In the meantime, persistent tariff jitters and disappointing February US Producer Price data are keeping the pair on the back foot.

Gold looks bid and trades close to $2,950
Gold extends its winning streak, moving toward the $2,950 mark after notching gains over the past two sessions. Heightened fears of an economic downturn, spurred by escalating trade tensions, have fueled a risk-off environment—further boosting the allure of the precious metal as a safe-haven asset.

GBP/USD remains offered near 1.2940 on USD buying
The continuation of the buying interest in the Greenback keeps the risk complex under pressure, motivating GBP/USD to recede to the 1.2940 region and reverse two consecutive days of gains for the time being.

Metaverse narrative stalls as price action fades, but on-chain data signals continuing accumulation
Metaverse tokens are cryptocurrencies associated with virtual worlds, digital economies, and immersive online experiences. Tokens like Sandbox, Decentraland, and Axie Infinity, three of the most prominent assets during the Metaverse boom of 2021, continue to face correction since they topped in early December.

Brexit revisited: Why closer UK-EU ties won’t lessen Britain’s squeezed public finances
The UK government desperately needs higher economic growth as it grapples with spending cuts and potential tax rises later this year. A reset of UK-EU economic ties would help, and sweeping changes are becoming more likely.

The Best brokers to trade EUR/USD
SPONSORED Discover the top brokers for trading EUR/USD in 2025. Our list features brokers with competitive spreads, fast execution, and powerful platforms. Whether you're a beginner or an expert, find the right partner to navigate the dynamic Forex market.
