Gold Price Forecast: XAU/USD pares biggest weekly losses since March 2020 below $1,800
- Gold edges higher, keeps recovery moves from seven-week low.
- US dollar pullback favor short-covering from the key Fibonacci retracement support.
- Inflation expectations, stimulus hopes back mildly upbeat sentiment, options market remain most bearish since late February.
- Lack of major catalysts can extend the bounce but bears aren’t out of the woods.

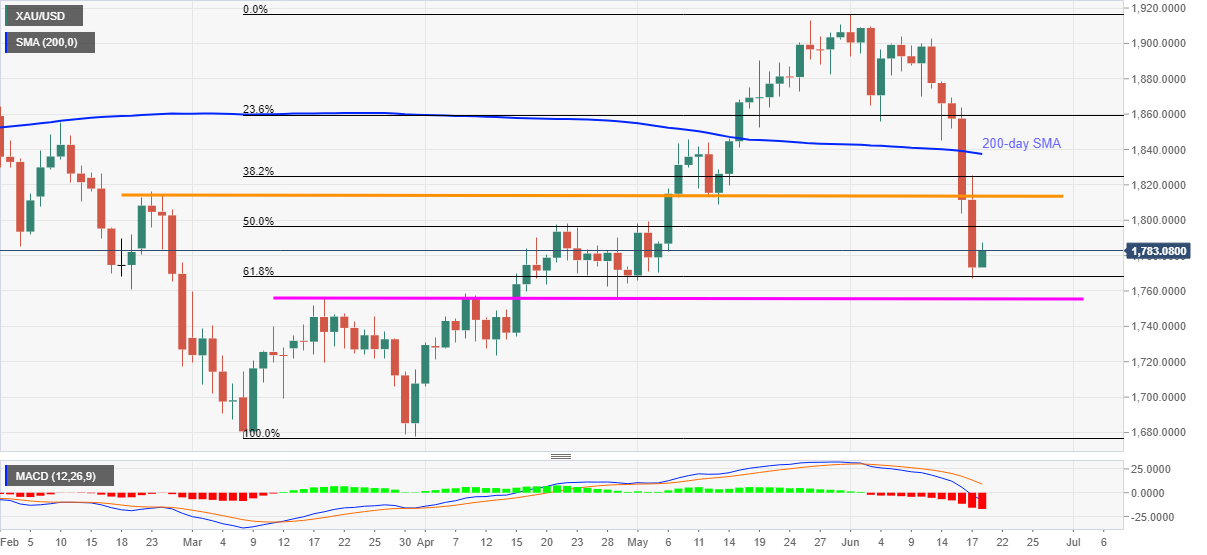
Gold (XAU/USD) portrays a corrective pullback during the worst week for bulls since March 2020, up 0.57% near $1,783 by the press time of the pre-European session on Friday.
While technical support and sluggish markets could best describe the reasons for gold’s latest bounce, easing reflation fears and optimism surrounding US President Joe Biden’s infrastructure spending plan adds to the market’s consolidation.
As per that latest 10-year breakeven inflation rate data from the St. Louis Federal Reserve (FRED), inflation expectations are the lowest since March. This suggests that the markets believe in the Fed’s comments over “transitory” inflation jump and dims the US dollar’s safe-haven demand.
On the other hand, Wall Street Journal (WSJ) came out with the news suggesting the progress in multi-billion dollars worth of spending by the Biden administrations. “A growing bipartisan group of lawmakers and the White House haggled over how to finance a roughly $1 trillion infrastructure proposal, awaiting feedback from President Biden as Democrats began discussions on a separate economic package that could cost up to $6 trillion,” said the WSJ.
It’s worth noting that recently easing fears of the covid in Asia and a bit softer Delta variant woes in the UK also contribute to the gold’s latest corrective pullback.
On the contrary, options market prints the most bearish signs for gold since late February as the risk reversal, a ratio of call options (bullish) to the put ones (bearish) drops -0.6000 by the end of Thursday North American count. The same keeps gold bears hopeful.
Against this backdrop, the US dollar index (DXY) steps back from a two-month top but stays on the road to the highest weekly gains since September 2020, down 0.10% around 91.82 whereas S&P 500 Futures print mild gains by the press time. Though, the US 10-year Treasury yields struggle for clear direction and probes gold buyers of late.
Given the lack of major data/events up for publishing during the rest of Friday, gold prices may track US dollar moves. The same highlights inflation expectations and stimulus headlines as the key catalysts to watch for fresh impulse during the likely dull end to the volatile week.
Technical analysis
Gold’s bounce off 61.8% Fibonacci retracement of March-June upside lacks momentum as MACD favors bears. Additionally, multiple strong upside hurdles will offer a bumpy road to the recovery, if at all it happens, which in turn could disappoint gold buyers.
Among the important resistances, a 50% Fibonacci retracement level of $1,797 and a horizontal line from late February, around $1,815, should be watched during the short term.
If at all the gold bulls manage to cross the $1,815 hurdle, 200-day SMA near $1,837 will be a tough nut to crack for them.
On the contrary, a downside break of 61.8% Fibonacci retracement level near $1,768 will be challenged by three-month-old horizontal support close to $1,755.
It should, however, be noted that the quote’s weakness past $1,755 will make gold prices vulnerable to retest the $1,700 threshold, with the mid-April low of $1,723 likely offering an intermediate halt during the fall.
Daily chart
Trend: Bearish
Also read....
Gold Price Forecast: XAU/USD recovers to $1,785, snaps five-day downtrend on USD pullback
Gold asks: Will the economic boom continue?
Author

Anil Panchal
FXStreet
Anil Panchal has nearly 15 years of experience in tracking financial markets. With a keen interest in macroeconomics, Anil aptly tracks global news/updates and stays well-informed about the global financial moves and their implications.


