Gold Price Forecast: XAU/USD needs a break below $1,784 to extend the correction – Confluence Detector
- Gold price fails to capitalize on broad US dollar weakness and sluggish Treasury yields.
- US CPI data shows the first sign of peak inflation but not enough to dissuade hawkish Fed.
- XAU/USD bears could extend control below the key $1,784 support.

Gold price is keeping the corrective momentum intact, as it remains below the $1,800 mark. The bright metal is on its retreat from monthly highs of $1,808 after softer US inflation triggered a sharp sell-off in the dollar alongside the Treasury yields. Odds of a 75 bps September Fed rate hike have dropped to nearly 43% vs. 68% seen pre-inflation data release. The greenback is resuming its downtrend this Thursday, as markets continue to believe that a one-time softening in the price pressure is unlikely to dissuade the Fed from altering its monetary policy course. Therefore, the non-interest-bearing gold remains under pressure, helped by sluggish price action in the yields. Although the downside appears cushioned (for now) amid resurfacing US-China trade tensions and renewed covid lockdowns in some of the Chinese cities and towns.
Also read: Gold Price Forecast: Bear cross outweighs softer US inflation, 50 DMA support at risk
Gold Price: Key levels to watch
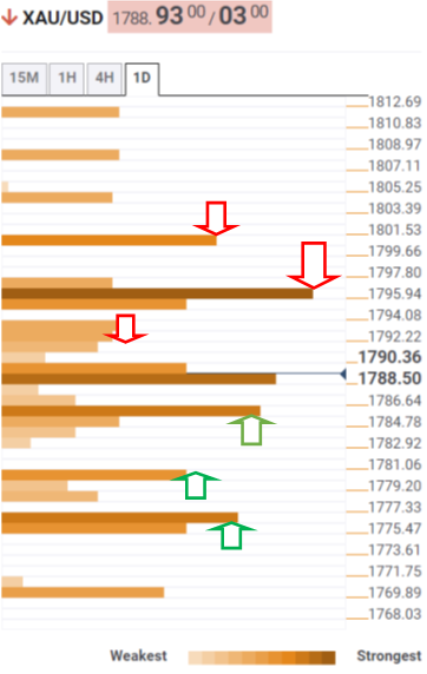
The Technical Confluence Detector shows that the gold price is challenging the $1,787 support, which is the SMA5 one-day and the previous day’s low.
The next crucial downside cap for XAU/USD is aligned at $1,784, the convergence of the SMA50 one-day and the Fibonacci 23.6% one-week.
Should sellers manage to find a strong foothold below the latter, a fresh drop towards the Fibonacci 38.2% one-week at $1,780 will be on the table.
The line in the sand for gold bulls is seen at the confluence of the SMA10 one-day and the pivot point one-day S2 at $1,775.
On the upside, Fibonacci 23.6% one-day at $1,792 guards the immediate upside, above which the $1,795 supply zone will be tested. That area is the intersection of the Fibonacci 38.2% one-day, the previous week’s high and the pivot point one-week R1.
Bulls will then target the Fibonacci 61.8% one-day at $1,800, bringing the monthly high of $1,808 back in sight.
Here is how it looks on the tool
About Technical Confluences Detector
The TCD (Technical Confluences Detector) is a tool to locate and point out those price levels where there is a congestion of indicators, moving averages, Fibonacci levels, Pivot Points, etc. If you are a short-term trader, you will find entry points for counter-trend strategies and hunt a few points at a time. If you are a medium-to-long-term trader, this tool will allow you to know in advance the price levels where a medium-to-long-term trend may stop and rest, where to unwind positions, or where to increase your position size.
Author

Dhwani Mehta
FXStreet
Residing in Mumbai (India), Dhwani is a Senior Analyst and Manager of the Asian session at FXStreet. She has over 10 years of experience in analyzing and covering the global financial markets, with specialization in Forex and commodities markets.


