- Gold price remains at the hands of US Treasury yields’ price action.
- Inflation concerns and Fed speculation to the lead the way.
- Gold 2022 Outlook: Correlation with US T-bond yields to drive yellow metal.
Gold price briefly disconnected from the price action in the Treasury yields on Wednesday but has returned to its negative relationship with the US rates this Thursday. Gold price has stalled its upsurge, consolidating below two-month highs amid firmer yields. China’s policy easing driven risk-on mood also limits gold’s gains. Although decade-high inflation rates globally have gold bulls covered while Russia-Ukraine crisis also helps keep the buoyant tone intact around the safe-haven.
Read: Gold Price Forecast: ‘Buy the dips’ amid inflation and geopolitical concerns
Gold Price: Key levels to watch
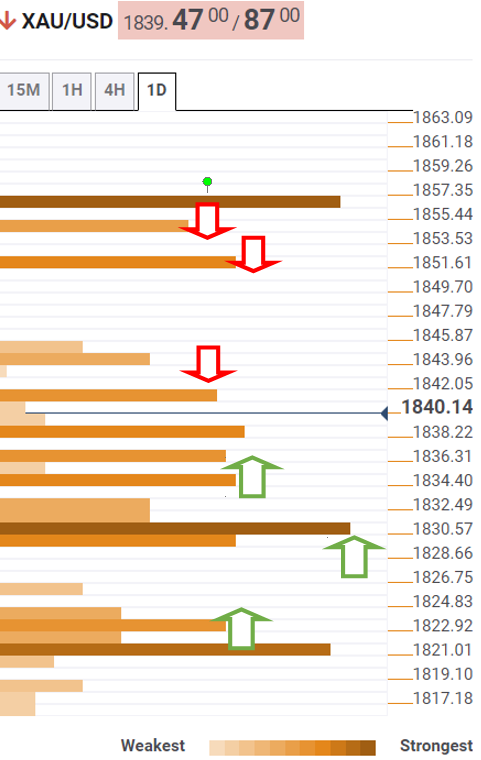
The Technical Confluences Detector shows that the gold price is likely to face a dense cluster of healthy support levels around $1,835, which is the convergence of the Fibonacci 23.6% one-day, pivot point one-week R1 and SMA5 four-hour.
If the downside pressure intensifies, then bears could challenge critical support at $1,831. The previous month’s high coincides with the Fibonacci 38.2% one-day at that point.
The next powerful support is seen around $1,821, which is the intersection of the SMA5 one-day, pivot point one-day S1 and Fibonacci 23.6% one-week.
Alternatively, immediate resistance aligns at the two-month highs of $1,844, above which the pivot point one-week R2 at $1,850.
The pivot point one-day R1 at $1,854 will be the next upside target for gold bulls.
Here is how it looks on the tool
About Technical Confluences Detector
The TCD (Technical Confluences Detector) is a tool to locate and point out those price levels where there is a congestion of indicators, moving averages, Fibonacci levels, Pivot Points, etc. If you are a short-term trader, you will find entry points for counter-trend strategies and hunt a few points at a time. If you are a medium-to-long-term trader, this tool will allow you to know in advance the price levels where a medium-to-long-term trend may stop and rest, where to unwind positions, or where to increase your position size.
Information on these pages contains forward-looking statements that involve risks and uncertainties. Markets and instruments profiled on this page are for informational purposes only and should not in any way come across as a recommendation to buy or sell in these assets. You should do your own thorough research before making any investment decisions. FXStreet does not in any way guarantee that this information is free from mistakes, errors, or material misstatements. It also does not guarantee that this information is of a timely nature. Investing in Open Markets involves a great deal of risk, including the loss of all or a portion of your investment, as well as emotional distress. All risks, losses and costs associated with investing, including total loss of principal, are your responsibility. The views and opinions expressed in this article are those of the authors and do not necessarily reflect the official policy or position of FXStreet nor its advertisers. The author will not be held responsible for information that is found at the end of links posted on this page.
If not otherwise explicitly mentioned in the body of the article, at the time of writing, the author has no position in any stock mentioned in this article and no business relationship with any company mentioned. The author has not received compensation for writing this article, other than from FXStreet.
FXStreet and the author do not provide personalized recommendations. The author makes no representations as to the accuracy, completeness, or suitability of this information. FXStreet and the author will not be liable for any errors, omissions or any losses, injuries or damages arising from this information and its display or use. Errors and omissions excepted.
The author and FXStreet are not registered investment advisors and nothing in this article is intended to be investment advice.
Recommended content
Editors’ Picks

Gold remains close to record highs after poor US data
Gold now treads water near the $3,330 region on the back of safe-haven demand, usual trade effervescence, and another weaker-than-estimated US inflation gauge.

EUR/USD keeps its bullish bias near 1.1360 on US PPI
EUR/USD pulled back from its multi-year high above 1.1400 but still maintained a solid position around 1.1360 at the end of the week. The US Dollar remains on the back footing following disappointing results from US Producer Prices.

GBP/USD hovers around 1.3100, Dollar stays well offered
GBP/USD maintains its bullish streak, climbing to fresh tops around 1.3150 earlier in the day. The US Dollar trades with heavy gains on escalating China-US trade crisis, US recession fears and soft US Producer Prices.

Bitcoin, Ethereum, Dogecoin and Cardano stabilze – Why crypto is in limbo
Bitcoin, Ethereum, Dogecoin and Cardano stabilize on Friday as crypto market capitalization steadies around $2.69 trillion. Crypto traders are recovering from the swing in token prices and the Monday bloodbath.

Trump’s tariff pause sparks rally – What comes next?
Markets staged a dramatic reversal Wednesday, led by a 12% surge in the Nasdaq and strong gains across major indices, following President Trump’s unexpected decision to pause tariff escalation for non-retaliating trade partners.

The Best brokers to trade EUR/USD
SPONSORED Discover the top brokers for trading EUR/USD in 2025. Our list features brokers with competitive spreads, fast execution, and powerful platforms. Whether you're a beginner or an expert, find the right partner to navigate the dynamic Forex market.