- Gold is hamstrung by the strength of the US dollar.
- Technically, the bulls might have a hard time pulling away from the hourly W-formation.
- ECB and Fed divergence should underpin the greenback while oil prices cripple the euro.
Update: Gold (XAU/USD) looks to extend its oscillation in a narrow range of $1,961.07-2,002.67 going forward amid the absence of any fundamental trigger in the market. The precious metal is trading lackluster despite an improved market mood, as the $2,000 level once again acted as a stiff reisstance. Markets in the Asia domain are following the cues in the US markets. A bloodbath has been recorded in the S&P500 on Monday as the index nosedived almost 3%.
Meanwhile, the US dollar index (DXY) is also facing headwinds near the psychological figure of 100.00. It would be justified to claim some caution in the DXY before the disclosure of US Consumer Price Index (CPI) numbers on Thursday. The US inflation numbers are likely to print at 7.9% higher than the earlier print at 7.8%. Although, to some extent, the market has also discounted a 50-basis point (bps) rate hike as it has remained in traction for a decent time. Therefore, the safe-haven assets require a potential trigger to improve the safe-haven appeal.
Meanwhile, the 10-year US Treasury yields have inched near 1.8% on rising expectations of a tightening policy by the Federal Reserve (Fed).
End of Update
The price of gold is firm in Tokyo and eyes the $2,000 level. However, the hourly structure on the charts is not conducive at this point for sustained gains and the focus, from a technical stance, is on the hourly W-formation#s neckline near $1,984 as illustrated below.
Meanwhile, XAU/USD has been, for the most part, a US dollar story at the start of the week. The greenback rose on Monday, lifted by safe-haven flows, which hamstrung the precious metal to some extent. The markets weighed the effects on the global economic growth of skyrocketing oil prices that hit 14-year highs. Both the EU and US are considering banning Russian crude imports. Brent, the globe's benchmark oil price, rallied to as high as $138bbls as a consequence.
Meanwhile, the dollar index, DXY, which measures the value of the greenback against six global peers, was moving in in the 100 level marking a high of 99.418. Across the Atlantic, the euro was down 0.7% against the dollar at $1.08575 on concerns that higher energy prices will spark stagflation in the European economy. The consensus is that the higher prices pose less threat to the Us than it does to the Eurozone. While Russian crude represents only 3% of domestic energy imports, for Europe, Russia is a key provider. Russia provides 25% of the EU's crude and 40% of its natural gas.
Additionally, the central bank divergence is driving the US dollar. The week is absent of Fed speakers due to the media embargo ahead of next week’s FOMC meeting. However, with the European Central Bank this week, traders will be reminded that the Fed is moving forward whereas the ECB is not and that should be USD favorable ad a weight for the gold price despite the risk-off environment.
The market is fully priced for a 25 bp hike on March 16 as the start of the tightening cycle. ''Looking ahead, 150 bp of tightening is priced in over the next 12 months, followed by another 25 bp in the following 12 months that would see the Fed Funds rate peak near 1.75%,'' analysts at Brown Brothers Harriman said.
''We continue to believe that the terminal rate will have to be much higher than this, but the Ukraine crisis has pushed Fed tightening expectations lower. January consumer credit is the only US data report today and is expected at $24.5 bln vs. $18.9 bln in December.''
As for those that believe the Fed will not be able to make a move due to the uncertainties relating to the war, analysts at TD securities had this to say: ''Geopolitical tensions would be unlikely to derail the Fed's plans to hike and to withdraw liquidity using quantitative tightening if inflation expectations show additional signs of de-anchoring. However, if the shock simultaneously dents consumer sentiment, the Fed will have to walk a tight-rope between its unemployment and inflation targets.''
Gold technical analysis

The W-formation's neckline and support area come in at around $1,985 from where the price could be drawn for the session ahead. However, should this area fail to support, then there will be a focus on the downside as per the daily chart's market structure as follows:
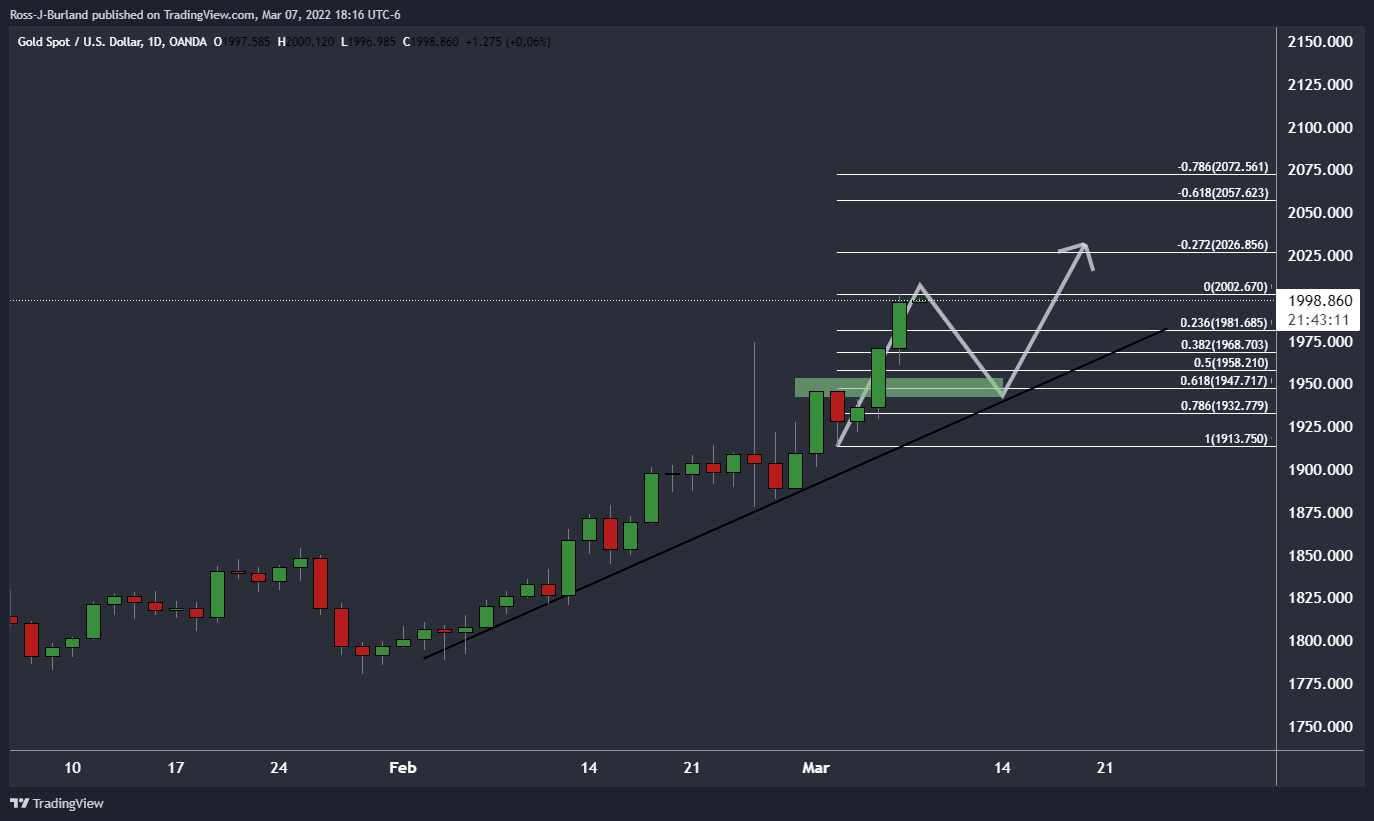
$1,950 meets the old resistance and a 61.8% golden ratio target. However, $1,975 as the 24 Feb. hoghs could price to be firm as could the 23.6% and 38.2% ratios at $1,981 and $1,968 respectively.
On the other hand, should the price break $2,000, it could be blue skies for the foreseeable future to target the 2020 summer highs of $2,075.
Information on these pages contains forward-looking statements that involve risks and uncertainties. Markets and instruments profiled on this page are for informational purposes only and should not in any way come across as a recommendation to buy or sell in these assets. You should do your own thorough research before making any investment decisions. FXStreet does not in any way guarantee that this information is free from mistakes, errors, or material misstatements. It also does not guarantee that this information is of a timely nature. Investing in Open Markets involves a great deal of risk, including the loss of all or a portion of your investment, as well as emotional distress. All risks, losses and costs associated with investing, including total loss of principal, are your responsibility. The views and opinions expressed in this article are those of the authors and do not necessarily reflect the official policy or position of FXStreet nor its advertisers. The author will not be held responsible for information that is found at the end of links posted on this page.
If not otherwise explicitly mentioned in the body of the article, at the time of writing, the author has no position in any stock mentioned in this article and no business relationship with any company mentioned. The author has not received compensation for writing this article, other than from FXStreet.
FXStreet and the author do not provide personalized recommendations. The author makes no representations as to the accuracy, completeness, or suitability of this information. FXStreet and the author will not be liable for any errors, omissions or any losses, injuries or damages arising from this information and its display or use. Errors and omissions excepted.
The author and FXStreet are not registered investment advisors and nothing in this article is intended to be investment advice.


Recommended content
Editors’ Picks

AUD/USD touches two-week high near 0.6350 after RBA meeting minutes
AUD/USD attracts buyers for the fifth straight day on Tuesday and climbs to a nearly two-week low near 0.6350 following the release of RBA minutes, which indicated that the May meeting would be an opportune time to reconsider reacting to potential risks. This, along with a positive risk tone, acts as a tailwind for the Aussie.

USD/JPY trades with positive bias above 143.00; upside potential seems limited
USD/JPY gains some positive traction on Tuesday and now seems to have snapped a three day losing streak to a multi-month low touched last week. The upbeat market mood undermines the safe-haven JPY and lends support amid a modest USD uptick.

Gold price holds steady above $3,200; remains close to all-time peak
Gold price trades above the $3,200 mark following the previous day's modest pullback from a fresh record high as the escalating US-China trade war continues to underpin the safe-haven bullion. Moreover, the Fed rate cut bets lend support to the XAU/USD.

US Homeland Security probes Anchorage digital bank amid Blackrock custody expansion
US Homeland Security’s “El Dorado Task Force” is investigating Anchorage Digital Bank for potential financial misconduct. Anchorage previously faced regulatory action for BSA/AML compliance failures.

Is a recession looming?
Wall Street skyrockets after Trump announces tariff delay. But gains remain limited as Trade War with China continues. Recession odds have eased, but investors remain fearful. The worst may not be over, deeper market wounds still possible.

The Best brokers to trade EUR/USD
SPONSORED Discover the top brokers for trading EUR/USD in 2025. Our list features brokers with competitive spreads, fast execution, and powerful platforms. Whether you're a beginner or an expert, find the right partner to navigate the dynamic Forex market.