Gold Price Forecast: XAU/USD grinds near $1,970 amid Fed concerns, debt ceiling woes – Confluence Detector
- Gold Price remains sidelined around key support confluence as markets await for Fed Minutes, US debt ceiling extension.
- Anxiety ahead of the key data/events prods XAU/USD traders amid mixed clues.
- Hawkish Fed bets, hopes of no US default underpin bearish bias about the Gold price.

Gold Price (XAU/USD) treads water around $1,975 heading into Wednesday’s European session. In doing so, the precious metal portrays the market’s inaction amid mixed feelings and cautious mood ahead of the key data/events. That said, the Gold Price previously cheered the US Dollar’s retreat amid a deadlock in the talks to resolve the debt ceiling problem. Also likely to prod the US Dollar bulls is the latest retreat in the US Treasury bond yields amid mixed US PMIs, mostly upbeat.
It should be observed that the market sentiment remains sluggish ahead of the US debt ceiling talks and Minutes of the latest Federal Open Market Committee (FOMC) Monetary Policy Meeting.
Also read: Gold Price Forecast: XAU/USD holds within familiar level ahead of FOMC Minutes
Gold Price: Key levels to watch
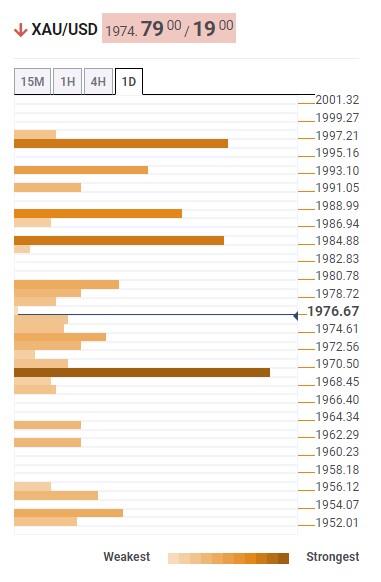
Our Technical Confluence Indicator signals that the Gold price seesaws around $1,970 support confluence comprising a middle band of the Bollinger on four-hour, Fibonacci 38.2% on one day and 23.6% on one-week.
In a case where the Gold Price remains bearish past $1,970, the odds of witnessing a slump toward the late swing low of $1,934 can’t be ruled out.
However, the lower band of the Bollinger on the Daily chart, around $1,950, may act as an intermediate halt during the XAU/USD’s fall between $1,970 and $1,934.
Alternatively, Pivot Point one-day R1 and the upper line of the Bollinger on the four-hour chart, around $1,985, caps the immediate upside of the Gold price.
Following that, Fibonacci 61.8% on one-week, around $1,997, will precede the $2,000 round figure to prod the XAU/USD buyers.
Here is how it looks on the tool
About Technical Confluences Detector
The TCD (Technical Confluences Detector) is a tool to locate and point out those price levels where there is a congestion of indicators, moving averages, Fibonacci levels, Pivot Points, etc. If you are a short-term trader, you will find entry points for counter-trend strategies and hunt a few points at a time. If you are a medium-to-long-term trader, this tool will allow you to know in advance the price levels where a medium-to-long-term trend may stop and rest, where to unwind positions, or where to increase your position size
Author

Anil Panchal
FXStreet
Anil Panchal has nearly 15 years of experience in tracking financial markets. With a keen interest in macroeconomics, Anil aptly tracks global news/updates and stays well-informed about the global financial moves and their implications.


