- Gold price has shown a perpendicular downfall after retreating from $1,985.00 amid a solid recovery in the USD index.
- Plenty of US economic indicators are strengthening the need of pausing interest rates by the Fed.
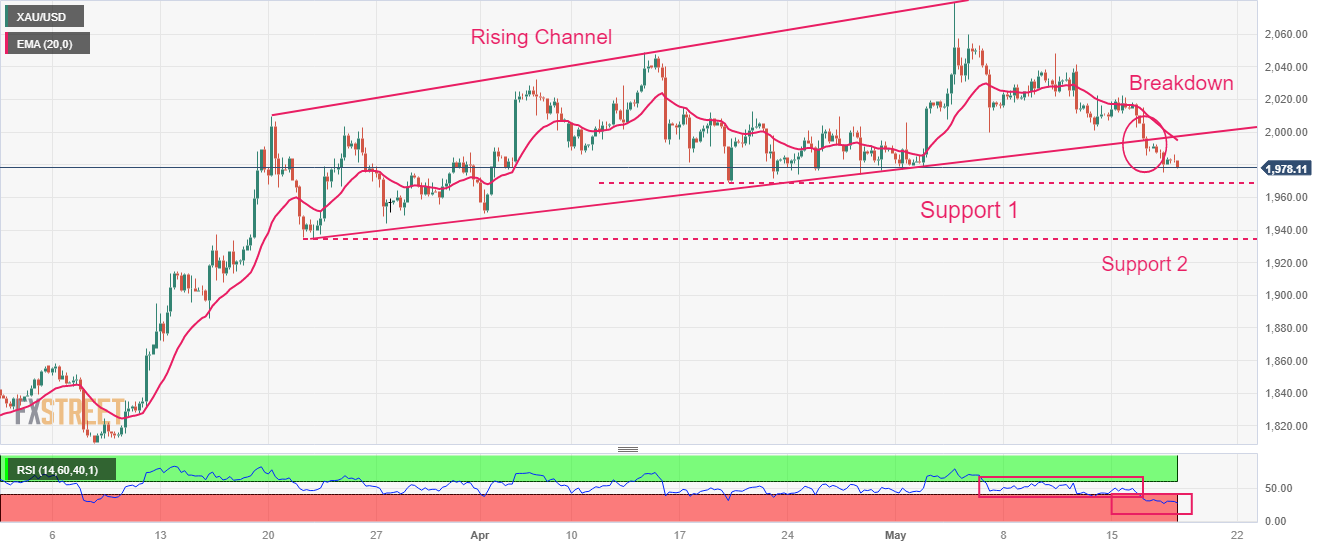
- Gold price has shown a vertical fall after delivering a breakdown of the Rising Channel pattern.
Gold price (XAU/USD) has witnessed immense selling pressure after retreating from $1,985.00 in the early European session. The precious metal is expected to deliver more weakness on a slippage below the immediate support of $1,970.00 as soaring optimism for the US debt-ceiling raise approval is weighing heavily on bullions.
S&P500 futures have also sensed selling pressure after some recovery, portraying a rebound in the risk-aversion theme. The US Dollar Index (DXY) is all set to recapture the critical resistance of 103.00 on expectations that the US debt-ceiling raise proposal would get approval by compromising President’s spending initiatives.
House of Representatives Speaker Joseph McCarthy has got ready to hike the US borrowing cap over the compromise of further budget deficit as the duo could be a disaster for the US economy.
The US Dollar Index is managing to defend its downside despite higher anticipation for a pause in the policy-tightening spell by the Federal Reserve (Fed). According to a poll by Reuters current interest rate at 5.00-5.25% will stay by the end of 2023.
Right from consistent decline in United States inflation, easing labor market conditions to contracting retail demand and deepening fears of economic recession, plenty of economic indicators are strengthening the need of pausing interest rates.
Gold technical analysis
Gold price has shown a perpendicular fall after delivering a breakdown of the Rising Channel chart pattern formed on a four-hour scale. Potential supports are placed from April 19 and March 21 low at $1,969.26 and $1,935.68 respectively. Downward-sloping 20-period Exponential Moving Average (EMA) at $1,994.56 is barricading the Gold bulls.
The Relative Strength Index (RSI) (14) has slipped into the bearish range of 20.00-40.00, which indicates more downside ahead.
Gold four-hour chart
Information on these pages contains forward-looking statements that involve risks and uncertainties. Markets and instruments profiled on this page are for informational purposes only and should not in any way come across as a recommendation to buy or sell in these assets. You should do your own thorough research before making any investment decisions. FXStreet does not in any way guarantee that this information is free from mistakes, errors, or material misstatements. It also does not guarantee that this information is of a timely nature. Investing in Open Markets involves a great deal of risk, including the loss of all or a portion of your investment, as well as emotional distress. All risks, losses and costs associated with investing, including total loss of principal, are your responsibility. The views and opinions expressed in this article are those of the authors and do not necessarily reflect the official policy or position of FXStreet nor its advertisers. The author will not be held responsible for information that is found at the end of links posted on this page.
If not otherwise explicitly mentioned in the body of the article, at the time of writing, the author has no position in any stock mentioned in this article and no business relationship with any company mentioned. The author has not received compensation for writing this article, other than from FXStreet.
FXStreet and the author do not provide personalized recommendations. The author makes no representations as to the accuracy, completeness, or suitability of this information. FXStreet and the author will not be liable for any errors, omissions or any losses, injuries or damages arising from this information and its display or use. Errors and omissions excepted.
The author and FXStreet are not registered investment advisors and nothing in this article is intended to be investment advice.
Recommended content
Editors’ Picks

EUR/USD recovers above 1.0950 on US Dollar weakness
EUR/USD is recovering further ground above 1.0850 in early Europe on Tuesday amid a broadly weaker US Dollar. The recovery in risk sentiment undermines the havem demand for the US Dollar, lifting the pair. Dovish Fed expectations also weigh negatively on the Greenback. Tariff updates eyed.

GBP/USD: Upside remains capped below 1.2800
GBP/USD is consolidating its rebound to near 1.2800 in Tuesday's European morning. The pair draws support from renewed US Dollar weakness and a positive shift in risk sentiment but US President Trump's tariff war and global growth concerns limit its upside.

Gold price moves away from multi-week low set on Monday; climbs to $3,000 mark
Gold price attracts some dip-buyers as worries over US tariffs revive safe-haven demand. Bets for more aggressive Fed rate cuts weigh on the USD and also benefit the commodity. A slight recovery in the global risk sentiment might cap further gains for the XAU/USD pair.

XRP battles tariff turbulence amid MVRV buy signal
Ripple seeks stability in a volatile crypto landscape influenced by macroeconomic factors, including reciprocal tariffs. The international money transfer token hit a low of $1.64 on Monday after opening the week at $1.92, representing a 14.5% daily drop.

Strategic implications of “Liberation Day”
Liberation Day in the United States came with extremely protectionist and inward-looking tariff policy aimed at just about all U.S. trading partners. In this report, we outline some of the more strategic implications of Liberation Day and developments we will be paying close attention to going forward.

The Best brokers to trade EUR/USD
SPONSORED Discover the top brokers for trading EUR/USD in 2025. Our list features brokers with competitive spreads, fast execution, and powerful platforms. Whether you're a beginner or an expert, find the right partner to navigate the dynamic Forex market.