Gold Price Forecast: XAU/USD eyes $1,773 and $1,781 amid weaker USD, yields – Confluence Detector
- Gold price extends post-Fed upside, as US dollar, yields keep falling.
- US Q2 GDP contraction smashes aggressive Fed rate hike expectations.
- The path of least resistance appears northside for XAU/USD.

Gold price is extending the post-Fed bullish momentum, despite eyeing a fourth straight monthly decline this Friday. The bright metal is set to end with the biggest weekly gain since mid-May, as the US dollar correction strengthens. A less hawkish Fed decision, US Q2 GDP contraction and falling odds of a 75 bps Sept lift-off by the world’s most powerful central bank have weighed heavily on the Treasury yields, as well as, the dollar. Growing recession fears in the US and Europe have underpinned the bullion’s safe-haven appeal. The end-of-the-month flows will likely play a crucial role in impacting gold price along with the US PCE inflation going forward.
Also read: Gold Price Forecast: XAU/USD bulls target $1,773 hurdle after recapturing 21 DMA
Gold Price: Key levels to watch
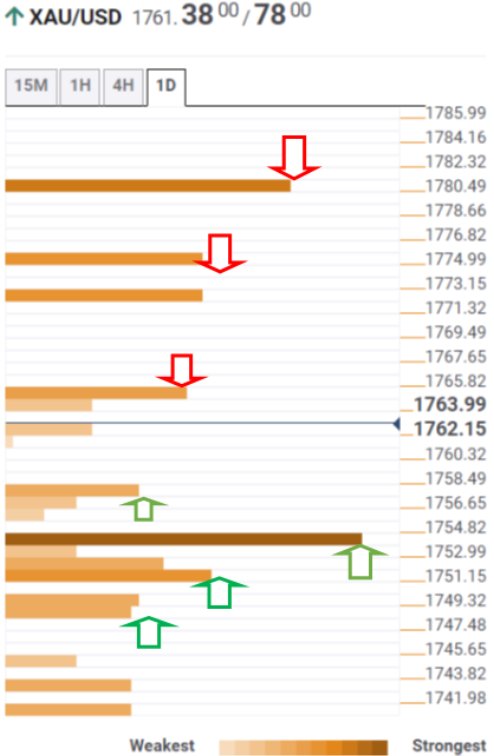
The Technical Confluence Detector shows that the gold price is looking to extend the uptrend above the pivot point one-day R1 at $1,765.
Acceptance above which will trigger a sharp advance towards the confluence of the SMA200 four-hour and pivot point one-day R2 at $1,773.
Further up, the pivot point one-week R2 at $1,775 will challenge the bearish commitments. Doors will then open up towards the pivot point one-month S1 at $1,781.
On the flip side, the precious day’s high of $1,757 will be the immediate cushion, below which the SMA5 four-hour meet with the pivot point one-month S2 at $1,754
The next stop for sellers is seen at the pivot point one-week R1 at $1,751, followed by the Fibonacci 38.2% one-day $1,748.
Here is how it looks on the tool
About Technical Confluences Detector
The TCD (Technical Confluences Detector) is a tool to locate and point out those price levels where there is a congestion of indicators, moving averages, Fibonacci levels, Pivot Points, etc. If you are a short-term trader, you will find entry points for counter-trend strategies and hunt a few points at a time. If you are a medium-to-long-term trader, this tool will allow you to know in advance the price levels where a medium-to-long-term trend may stop and rest, where to unwind positions, or where to increase your position size.
Author

Dhwani Mehta
FXStreet
Residing in Mumbai (India), Dhwani is a Senior Analyst and Manager of the Asian session at FXStreet. She has over 10 years of experience in analyzing and covering the global financial markets, with specialization in Forex and commodities markets.


