Gold Price Forecast: XAU/USD drops towards $1,825 support on recession fears, PMIs eyed
- Gold takes offers to refresh intraday low inside weekly symmetrical triangle.
- Fears of economic slowdown, monetary policy aggression weigh on prices amid a sluggish session.
- Concerns surrounding the US-China trade deal, Beijing’s economic growth also exert downside pressure.
- US PMIs, the second round of Fed Chair Powell’s testimony eyed for fresh impulse.

Gold Price (XAU/USD) renews intraday low around $1,832 as fears of economic slowdown join inflation woes to weigh on the metal prices amid a sluggish Asian session on Thursday. In doing so, the bullion stays on the way to the second consecutive weekly loss even as the US dollar fails to improve.
That said, the US Dollar Index (DXY) prints a four-day downtrend as Fed Chair Jerome Powell considered the present monetary policy bias appropriate to battle the inflation woes. It’s worth noting, however, that the Fed Boss’s readiness to use the aggressive measures, irrespective of their consequences, seemed to have put a floor under the greenback. On the same line is the latest news from Reuters signaling an upbeat print of June’s jobs report.
It’s worth noting that a slump in the US inflation expectations to the four-month low also drowns the greenback. That said, the US inflation expectations, as per the 10-year breakeven inflation rate per the St. Louis Federal Reserve (FRED) data, dropped for the third consecutive day to the fresh low since late February by the end of Wednesday’s North American session. That said, the inflation gauge’s latest print is 2.54%, the same as on February 25.
Elsewhere, a Reuters poll suggesting faster European Central Bank (ECB) rate hikes, to 0.75% by the year’s end, also challenge the gold prices. Additionally, the fall in the options market’s bullish bias over Gold Price, known as the risk reversal (RR), exerts downside pressure on the metal. That said, the spread between the call and put options, known as RR, dropped to the lowest levels in a week the previous day.
It should be noted, that the Fed and ECB aggression propel the market’s economic slowdown fears amid fragile activities.
Additionally, chatters that China President Xi Jinping may not be able to reach the optimistic growth targets, as well as the likely failures of the Sino-American trade talks, seem to weigh on the XAU/USD as well.
That said, S&P 500 Futures struggle for clear directions while US 10-year Treasury yields remain pressured around the weekly low, down 2.8 basis points to 3.13% by the press time.
Moving on, US S&P Global PMIs for June and the weekly Jobless Claims data will precede the second round of Fed Chair Jerome Powell’s Testimony will be important to watch for clear market directions.
Technical analysis
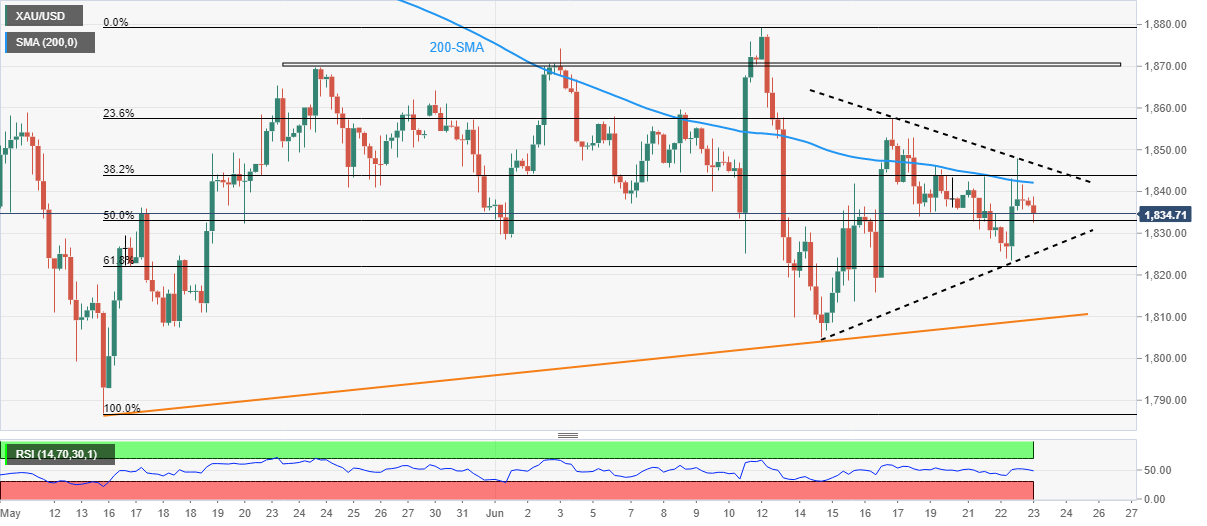
Gold extends pullback from the 200-SMA inside a one-week-old symmetrical triangle. The metal’s sidelined performance also gains support from steady RSI.
Hence, XAU/USD is likely declining towards the aforementioned triangle’s support line, around $1,825 by the press time.
However, the quote’s weakness past $1,825 will be challenged by an upward sloping support line from mid-May, around $1,809, as well as the $1,800 threshold.
On the contrary, recovery moves remain elusive until crossing the stated triangle’s resistance line, close to $1,847 at the latest. It’s worth noting that the 200-SMA level of $1,842 could guard the immediate rebound.
In a case where the bullion prices rally beyond $1,847, multiple hurdles around $1,870 could test the XAU/USD bulls before directing them to the monthly peak of $1,879.
Gold: Four-hour chart
Trend: Limited downside expected
Author

Anil Panchal
FXStreet
Anil Panchal has nearly 15 years of experience in tracking financial markets. With a keen interest in macroeconomics, Anil aptly tracks global news/updates and stays well-informed about the global financial moves and their implications.


