- Fed officials unanimously aim to achieve the 2% inflation target, but divisions emerge on the path forward.
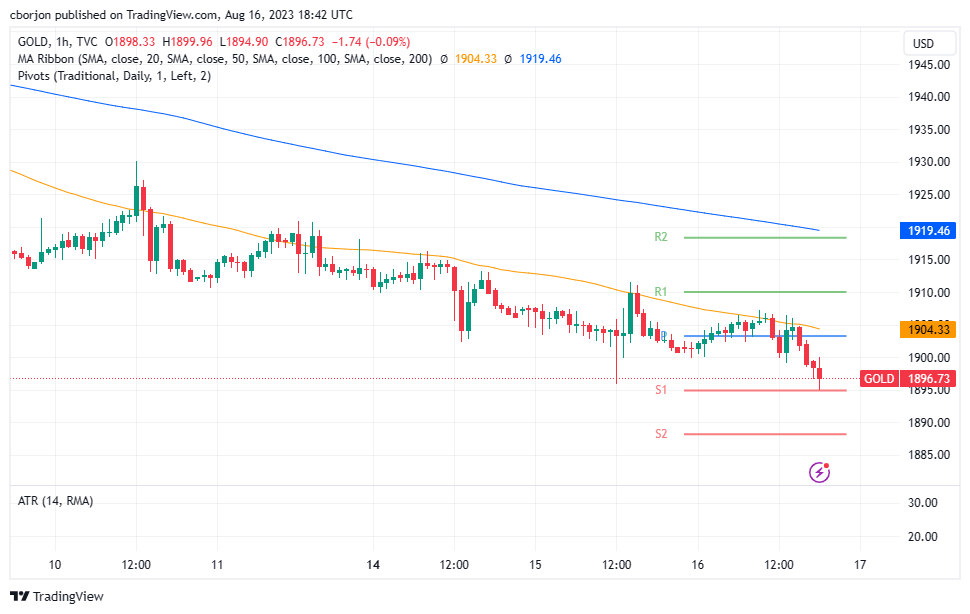
- XAU/USD reacts with a sharp drop, testing the S1 daily pivot point, while US Treasury yields and the greenback see upward movement.
- Key levels to watch include the $1,900 psychological mark and the 50-hour Moving Average at $1,904.34
Gold price treads water after the latest Federal Reserve’s (Fed) meeting minutes showed board officials were split between raising rates or keeping them unchanged at the July meeting. After the data release, XAU/USD trades volatile, hit a fresh 7-week low at $1,895.48 and is seesawing at around the $1,900-$1,890 area.
XAU/USD seesaws around the $1,900 mark as Federal Reserve minutes reveal split opinions on monetary policy
The minutes revealed a unanimous determination among all Federal Reserve officials to persist in their objective of lowering inflation to the targeted 2%, while most participants assessed that upside risks on inflation would require additional tightening.
However, a division within the Fed board became evident regarding monetary policy, as a “few” members advocated for maintaining the existing interest rates. Among them, Atlanta’s Fed President Raphael Bostic consistently voiced his stance in favor of unchanged rates.
The minutes showed that while the economy has displayed resilience, concerns persist about potential downsides to economic activity and possible risks of an increase in the unemployment rate.
Federal Reserve officials agreed that forthcoming rate decisions would be based on a comprehensive assessment of incoming data while adopting a cautious approach in the upcoming months.
XAU/USD reaction on hourly chart
As the minutes were released, the XAU/USD dropped sharply towards the S1 daily pivot point at $1,894.89 and bounced off that level. At the same time, US Treasury bond yields climbed with the 10-year benchmark note edging toward 4.246%, while the greenback hit a daily high of 103.457 before trimming some of its gains.
If XAU/USD achieves a daily close below $1,900, that could expose March’s 13 daily low of $1,867.17 as the next support, ahead of dropping towards the latest swing low of $1,809.48. Contrarily, if buyers reclaim $1,900, that could expose the 50-hour Moving Average (HMA) at $1,904.34, slightly above the daily pivot point.
XAU/USD Technical Levels
Information on these pages contains forward-looking statements that involve risks and uncertainties. Markets and instruments profiled on this page are for informational purposes only and should not in any way come across as a recommendation to buy or sell in these assets. You should do your own thorough research before making any investment decisions. FXStreet does not in any way guarantee that this information is free from mistakes, errors, or material misstatements. It also does not guarantee that this information is of a timely nature. Investing in Open Markets involves a great deal of risk, including the loss of all or a portion of your investment, as well as emotional distress. All risks, losses and costs associated with investing, including total loss of principal, are your responsibility. The views and opinions expressed in this article are those of the authors and do not necessarily reflect the official policy or position of FXStreet nor its advertisers. The author will not be held responsible for information that is found at the end of links posted on this page.
If not otherwise explicitly mentioned in the body of the article, at the time of writing, the author has no position in any stock mentioned in this article and no business relationship with any company mentioned. The author has not received compensation for writing this article, other than from FXStreet.
FXStreet and the author do not provide personalized recommendations. The author makes no representations as to the accuracy, completeness, or suitability of this information. FXStreet and the author will not be liable for any errors, omissions or any losses, injuries or damages arising from this information and its display or use. Errors and omissions excepted.
The author and FXStreet are not registered investment advisors and nothing in this article is intended to be investment advice.


Recommended content
Editors’ Picks

EUR/USD bounces off lows, retests 1.1370
Following an early drop to the vicinity of 1.1310, EUR/USD now manages to regain pace and retargets the 1.1370-1.1380 band on the back of a tepid knee-jerk in the US Dollar, always amid growing optimism over a potential de-escalation in the US-China trade war.

GBP/USD trades slightly on the defensive in the low-1.3300s
GBP/USD remains under a mild selling pressure just above 1.3300 on Friday, despite firmer-than-expected UK Retail Sales. The pair is weighed down by a renewed buying interest in the Greenback, bolstered by fresh headlines suggesting a softening in the rhetoric surrounding the US-China trade conflict.

Gold remains offered below $3,300
Gold reversed Thursday’s rebound and slipped toward the $3,260 area per troy ounce at the end of the week in response to further improvement in the market sentiment, which was in turn underpinned by hopes of positive developments around the US-China trade crisis.

Ethereum: Accumulation addresses grab 1.11 million ETH as bullish momentum rises
Ethereum saw a 1% decline on Friday as sellers dominated exchange activity in the past 24 hours. Despite the recent selling, increased inflows into accumulation addresses and declining net taker volume show a gradual return of bullish momentum.

Week ahead: US GDP, inflation and jobs in focus amid tariff mess – BoJ meets
Barrage of US data to shed light on US economy as tariff war heats up. GDP, PCE inflation and nonfarm payrolls reports to headline the week. Bank of Japan to hold rates but may downgrade growth outlook. Eurozone and Australian CPI also on the agenda, Canadians go to the polls.

The Best brokers to trade EUR/USD
SPONSORED Discover the top brokers for trading EUR/USD in 2025. Our list features brokers with competitive spreads, fast execution, and powerful platforms. Whether you're a beginner or an expert, find the right partner to navigate the dynamic Forex market.