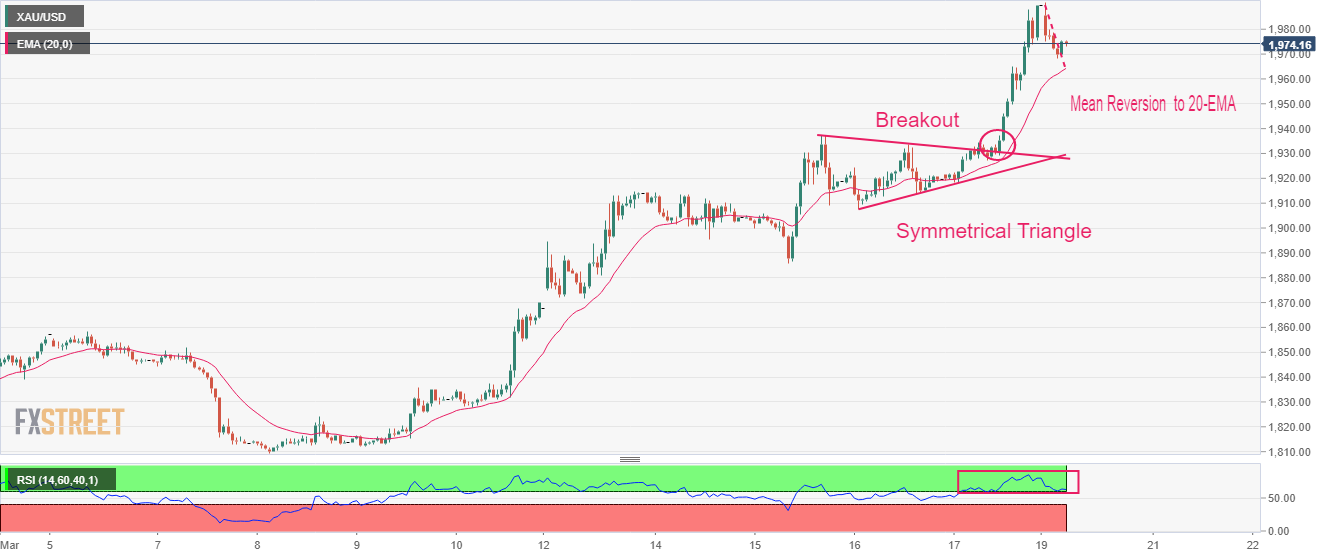
- Gold price has corrected to near $1,970.00 as investors are getting anxious about the Fed policy.
- Safe-haven appeal for Gold has been trimmed as UBS promised to rescue Credit Suisse.
- Gold bulls are experiencing a momentum loss and are expected to deliver a mean reversion to near the 20-EMA.
Gold price (XAU/USD) corrected to near $1,970.00 after UBS announced the Credit Suisse rescue plan. The precious metal is gauging a cushion around the $1,970.00 support, however, further correction looks possible.
Investors should be aware of the fact that the market participants were pumping funds into the yellow metal to safeguard themselves from the volatility associated with a potential banking fiasco. A buyout deal by UBS has trimmed fears of global banking turmoil. The buyout deal has sent a signal that central banks are prepared to provide assistance to commercial banks in order to retrieve the confidence of investors.
The US Dollar Index (DXY) is demonstrating a back-and-forth action around 103.80 as the market is preparing for the interest rate decision by the Federal Reserve (Fed), which is scheduled for Wednesday. Analysts at Danske Bank see Fed chair Jerome Powell raising rates by 25 basis points (bps) despite recent turmoil amid banking sector jitters.
Bulk morning gains generated by the S&P500 futures are halved now, portraying that the UBS-Credit Suisse deal is not sufficient enough to deal with the global banking jitters. Negative market sentiment would stay for a period of time as the banking mess is still to show true colors. Meanwhile, the UBS-Credit Suisse deal has trimmed demand for US government bonds, which were being considered as safe-haven. This has pushed the 10-year US Treasury yields higher to 3.46%.
Gold technical analysis
Gold price delivered a stalwart rally after a breakout of the Symmetrical Triangle chart pattern on an hourly scale. A breakout in the aforementioned chart pattern is followed by heavy volume and wide ticks. After a perpendicular rally, Gold bulls are experiencing a momentum loss and are expected to deliver a mean-reversion to near the 20-period Exponential Moving Average (EMA) at $1,964.00.
The Relative Strength Index (RSI) (14) is oscillating in the bullish range of 60.00-80.00, which indicates that the upside momentum is extremely solid.
Gold hourly chart
Information on these pages contains forward-looking statements that involve risks and uncertainties. Markets and instruments profiled on this page are for informational purposes only and should not in any way come across as a recommendation to buy or sell in these assets. You should do your own thorough research before making any investment decisions. FXStreet does not in any way guarantee that this information is free from mistakes, errors, or material misstatements. It also does not guarantee that this information is of a timely nature. Investing in Open Markets involves a great deal of risk, including the loss of all or a portion of your investment, as well as emotional distress. All risks, losses and costs associated with investing, including total loss of principal, are your responsibility. The views and opinions expressed in this article are those of the authors and do not necessarily reflect the official policy or position of FXStreet nor its advertisers. The author will not be held responsible for information that is found at the end of links posted on this page.
If not otherwise explicitly mentioned in the body of the article, at the time of writing, the author has no position in any stock mentioned in this article and no business relationship with any company mentioned. The author has not received compensation for writing this article, other than from FXStreet.
FXStreet and the author do not provide personalized recommendations. The author makes no representations as to the accuracy, completeness, or suitability of this information. FXStreet and the author will not be liable for any errors, omissions or any losses, injuries or damages arising from this information and its display or use. Errors and omissions excepted.
The author and FXStreet are not registered investment advisors and nothing in this article is intended to be investment advice.
Recommended content
Editors’ Picks

EUR/USD flirts with 1.0500 on mixed US PMI readings
The bullish momentum remains unchanged around EUR/USD on Friday as the pair keeps its trade close to the area of multi-week highs around the 1.0500 barrier in the wake of the release of mixed results from the preliminary US Manufacturing and Services PMIs for the current month.

GBP/USD challenges recent peaks near 1.2450
GBP/USD pushes harder and puts the area of recent two-week highs near 1.2450 to the test on the back of the intense sell-off in the Greenback, while the British pound also derives extra strength from earluer auspicious prints from advanced UK Manufacturing and Services PMIs.

Gold keeps the bid bias near its all-time high
Gold prices maintain the bid tone near their record top at the end of the week, helped by the intense weakness around the US Dollar, alleviating concerns surrounding Trump's tariff narrarive, and a somewhat more flexible stance towards China.

Dogelon Mars pumps more than 85%, whales dump 128 billion coins and realize a profit
Dogelon Mars (ELON) price continues its rally on Friday after rallying more than 18% this week. On-chain data shows that ELON whale wallets realized profits during the recent surge. The technical outlook suggests a rally continuation of the dog-theme meme coin, targeting double-digit gains ahead.

ECB and US Fed not yet at finish line
Capital market participants are expecting a series of interest rate cuts this year in both the Eurozone and the US, with two interest rate cuts of 25 basis points each by the US Federal Reserve and four by the European Central Bank (ECB).

Trusted Broker Reviews for Smarter Trading
VERIFIED Discover in-depth reviews of reliable brokers. Compare features like spreads, leverage, and platforms. Find the perfect fit for your trading style, from CFDs to Forex pairs like EUR/USD and Gold.
