- Gold price has jumped above the $1,950.00 resistance as the USD Index is struggling in extending its recovery.
- Investors’ risk-taking ability has dropped and the appeal for risk-perceived assets has softened.
- Gold price is marching towards the upper portion of the Falling Wedge pattern.
Gold price (XAU/USD) witnessed decent buying interest around $1,947.50 in the London session. The precious metal has climbed above the crucial resistance of $1,950.00 as investors are anticipating only one more interest rate hike from the Federal Reserve (Fed) this year.
S&P500 futures have extended their downside journey as investors have the excuse of an extended weekend in the United States due to Juneteenth. Investors’ risk-taking ability has dropped and the appeal for risk-perceived assets has softened.
Economists at HSBC believe that investors should prepare for some consolidation as valuations have risen, and the potential of further Fed tightening may cut into future earnings estimates and valuations in the short term. However, we feel the Fed is closer to the end of its monetary policy tightening cycle, and this should bode well for US equities.
The US Dollar Index (DXY) has turned sideways as the upside is restricted around 102.60 despite Fed chair Jerome Powell having confirmed that no rate cuts are appropriate this year. In spite of rising weekly jobless claims three times in a row, a jump in the Unemployment Rate to 3.8%, and softening of consumer and producer inflationary pressures due to lower gasoline prices, the Fed believes that core inflation is still persistent and labor market conditions have not softened enough to announce victory over the sticky Consumer Price Index (CPI).
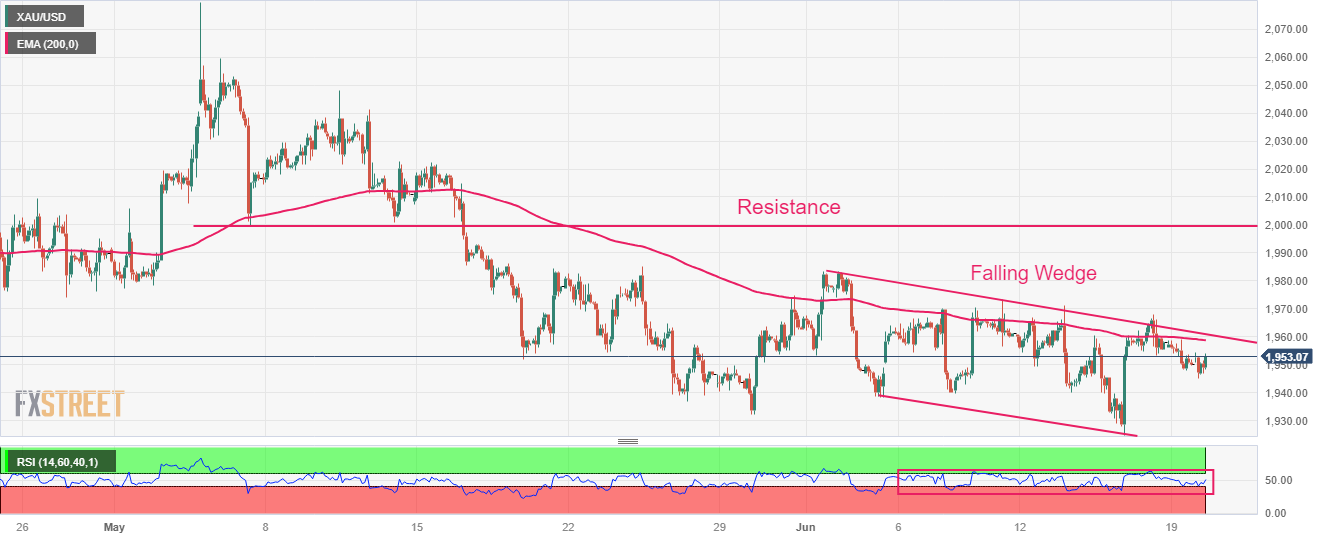
Gold technical analysis
Gold price is marching toward the upper portion of the Falling Wedge chart pattern, which indicates a consistent downside move followed by an upside breakout. The 200-period Exponential Moving Average (EMA) at $1,958.84 is acting as a barricade for the Gold bulls. Horizontal resistance is plotted from May 05 low around $2,000.00.
The Relative Strength Index (RSI) (14) is oscillating in the 40.00-60.00 range, which indicates a non-directional performance.
Gold two-hour chart
Information on these pages contains forward-looking statements that involve risks and uncertainties. Markets and instruments profiled on this page are for informational purposes only and should not in any way come across as a recommendation to buy or sell in these assets. You should do your own thorough research before making any investment decisions. FXStreet does not in any way guarantee that this information is free from mistakes, errors, or material misstatements. It also does not guarantee that this information is of a timely nature. Investing in Open Markets involves a great deal of risk, including the loss of all or a portion of your investment, as well as emotional distress. All risks, losses and costs associated with investing, including total loss of principal, are your responsibility. The views and opinions expressed in this article are those of the authors and do not necessarily reflect the official policy or position of FXStreet nor its advertisers. The author will not be held responsible for information that is found at the end of links posted on this page.
If not otherwise explicitly mentioned in the body of the article, at the time of writing, the author has no position in any stock mentioned in this article and no business relationship with any company mentioned. The author has not received compensation for writing this article, other than from FXStreet.
FXStreet and the author do not provide personalized recommendations. The author makes no representations as to the accuracy, completeness, or suitability of this information. FXStreet and the author will not be liable for any errors, omissions or any losses, injuries or damages arising from this information and its display or use. Errors and omissions excepted.
The author and FXStreet are not registered investment advisors and nothing in this article is intended to be investment advice.
Recommended content
Editors’ Picks

AUD/USD: The hunt for the 0.7000 hurdle
AUD/USD quickly left behind Wednesday’s strong pullback and rose markedly past the 0.6900 barrier on Thursday, boosted by news of fresh stimulus in China as well as renewed weakness in the US Dollar.

EUR/USD refocuses its attention to 1.1200 and above
Rising appetite for the risk-associated assets, the offered stance in the Greenback and Chinese stimulus all contributed to the resurgence of the upside momentum in EUR/USD, which managed to retest the 1.1190 zone on Thursday.

Gold holding at higher ground at around $2,670
Gold breaks to new high of $2,673 on Thursday. Falling interest rates globally, intensifying geopolitical conflicts and heightened Fed easing bets are the main factors.

Bitcoin displays bullish signals amid supportive macroeconomic developments and growing institutional demand
Bitcoin (BTC) trades slightly up, around $64,000 on Thursday, following a rejection from the upper consolidation level of $64,700 the previous day. BTC’s price has been consolidating between $62,000 and $64,700 for the past week.

RBA widely expected to keep key interest rate unchanged amid persisting price pressures
The Reserve Bank of Australia is likely to continue bucking the trend adopted by major central banks of the dovish policy pivot, opting to maintain the policy for the seventh consecutive meeting on Tuesday.

Five best Forex brokers in 2024
VERIFIED Choosing the best Forex broker in 2024 requires careful consideration of certain essential factors. With the wide array of options available, it is crucial to find a broker that aligns with your trading style, experience level, and financial goals.