Gold Price Forecast: XAU/USD bears in control despite optimism about United States debt ceiling extension
- Gold Price breaks short-term key supports as bears cheer firmer US Dollar.
- Hopes of United States debt limit extension, upbeat US data and hawkish Federal Reserve talks weigh on XAU/USD.
- S&P500 Futures remain depressed tracing downbeat Wall Street performance, Treasury bond yields rise amid risk-off mood.
- Risk catalysts will be the key to follow for the Gold price predictions.

Gold Price (XAU/USD) holds lower grounds at a two-week bottom surrounding $1,990 early Wednesday, after breaking the key short-term support lines during the previous day’s fall. That said, the yellow metal bears the burden of the strong US Dollar, as well as upbeat United States data, while failing to justify the optimism surrounding the US debt limit extension.
Gold price drops on firmer US Dollar, fails to cheer debt limit hopes
Gold price broke important supports and marked the biggest daily loss in nearly a fortnight as the US Dollar Index (DXY) remains firmer despite the recent relief in the risk markets due to the receding fears of the United States default. The reason for the DXY run-up could be linked to the strong US data and the hawkish Federal Reserve (Fed) commentary.
Recently, Reuters reported that the Democratic President Joe Biden and top congressional Republican Kevin McCarthy's US debt ceiling negotiations ended on Tuesday after less than an hour, as the looming fear of an unprecedented American debt default prompted Biden to cut short an upcoming Asia trip. The news also mentioned that the meeting ended on an upbeat and unexpected note as McCarthy, coming out of the meeting with Biden and other congressional leaders, said, "It is possible to get a deal by the end of the week."
On Tuesday, US Retail Sales improved to 0.4% MoM for April, from -0.7% prior (revised) versus 0.7% expected. More importantly, Retail Sales Control Group for the said month crossed market forecasts of 0.0% and -0.4% prior with 0.7% actual figure whereas Retail Sales ex Autos matches 0.4% MoM estimations for April¸ surpassing the -0.5% prior. Further, the US Industrial Production MoM rose to 0.5% for April versus expectations of printing a 0.0% figure.
It should be noted that Richmond Fed Thomas Barkin said in an interview with the Financial Times (FT) that if inflation persists, or God forbid accelerates, there’s no barrier in my mind to further increases in rates. On the same line, Cleveland Fed President Loretta Mester said, “I don’t think we're at that hold rate yet.”
Amid these plays, the US Treasury bond yields remained firmer and Wall Street witnessed losses on Tuesday, which in turn allowed the US Dollar to cheer the haven demand. As a result, the Gold price remained pressured.
China data, geopolitical fears also weigh on XAU/USD
Apart from what’s already mentioned above, downbeat data from China, one of the world’s biggest Gold consumers, also weigh on the XAU/USD price. Additionally, fears of more West versus Russia tension and the US-China tussles exert more downside pressure on the Gold price. It should be noted that the recession woes are an extra load on the Gold price.
Moving on, Wednesday’s light calendar may allow the Gold price to consolidate recent losses in a case where the sentiment improves. As a result, the risk catalysts will be eyed for clear directions of the XAU/USD.
Gold price technical analysis
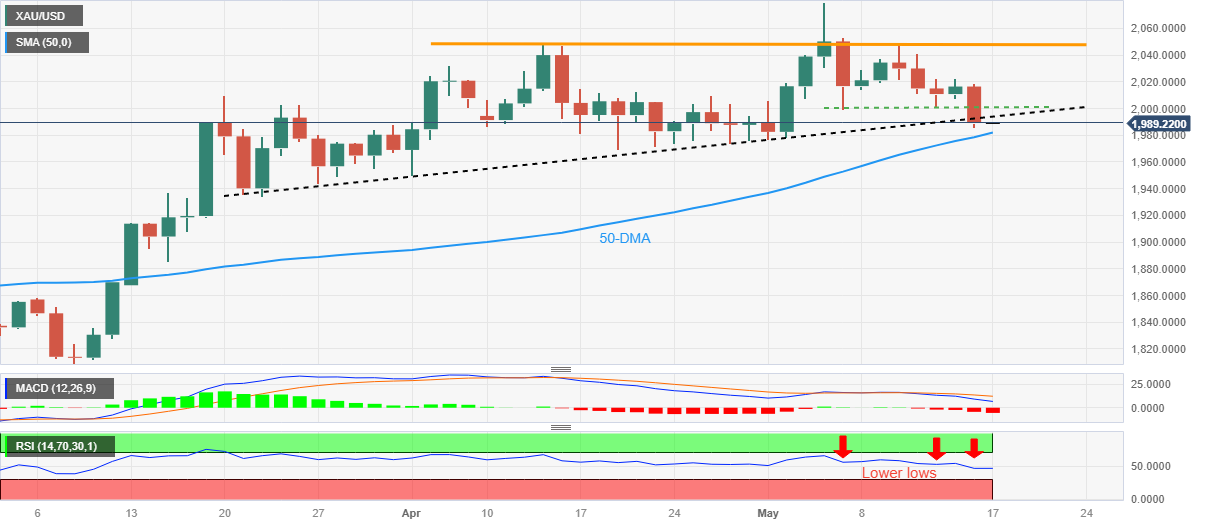
Gold price remains well below an eight-day-old horizontal support of around $2,000, as well as an upward-sloping support line from late March, close to $1,993 by the press time, suggesting the bear’s dominance.
It’s worth noting that the bearish signals from the Moving Average Convergence and Divergence (MACD) indicator teases sellers but the lower lows on the Relative Strength Index (RSI), placed at 14, hint at limited downside room.
As a result, the XAU/USD sellers might want to wait for a clear downside break of the 50-DMA support of $1,982 for conviction.
Meanwhile, the Gold price corrective bounce needs validation from the aforementioned support-turned-resistances around $1,993 and $2,000 before recalling the XAU/USD bulls targeting a five-week-old horizontal resistance area surrounding $2,050.
Following that, the latest all-time high of around $2,080 and the $2,100 round figure will be on the radars of the XAU/USD bulls.
Overall, the Gold price remains on the seller’s desk but a sustained downside break of $1,982 becomes necessary to convince bears.
Gold price: Daily chart
Trend: Recovery expected
Author

Anil Panchal
FXStreet
Anil Panchal has nearly 15 years of experience in tracking financial markets. With a keen interest in macroeconomics, Anil aptly tracks global news/updates and stays well-informed about the global financial moves and their implications.


