Gold Price Forecast: XAU/USD bears eye $1,900 with US/China data, Fed Minutes in mind
- Gold Price stays pressured after declining in last three consecutive weeks.
- Firmer United States Treasury bond yields, China concerns underpin US Dollar strength, weighing on XAU/USD.
- Technical analysis cites 200-DMA as the key support to test Gold bears.
- China/US data, FOMC Minutes eyed for clear directions of XAU/USD price.

Gold Price (XAU/USD) remains on the back foot around $1,910 as the trading week begins with no major surprises and a lighter macro line during the weekend. That said, the XAU/USD dropped for three consecutive weeks in the last, falling the most since mid-June at the latest, amid firmer US Treasury bond yields and the US Dollar. Also weighing on the Gold Price could be the fears emanating from China. It should be noted that a slew of data from the United States and China stand tall to challenge the XAU/USD moves this week.
Gold Price drops on firmer Treasury bond yields, China concerns
Gold Price dropped in the last three consecutive weeks as the US Treasury bond yields and China concerns underpinned the US Dollar’s haven demand, especially amid the broad economic uncertainty.
The unimpressive US inflation data allowed the Fed policymakers to cheer the victory over price pressure but the traders sought more details to welcome the policy pivot concerns. The same joined the fears about China, the world’s biggest Gold customer, to weigh on the XAU/USD price.
That said, the US 10-year Treasury bond yields rose for the fourth consecutive week despite the initial retreat. With this, US Dollar managed to post a four-week uptrend in the last, backed by mostly upbeat US data and the market’s indecision.
Talking about the data, the US Consumer Price Index (CPI) numbers for July failed to lift the Fed bets for September, suggesting the nearness to the policy pivot. However, the CPI details and other price pressure measures managed to keep the Greenback buyers hopeful.
It’s worth noting that the US Producer Price Index (PPI) for July, the preliminary readings of the University of Michigan’s (UoM) Consumer Sentiment Index (CSI) for August and the UoM 5-Year Consumer Inflation Expectations for the said month helped the USD benefit on Friday. Further, the US one-year inflation outlook edged lower to 3.3% from 3.4%.
That said, the US PPI improved to 0.3% MoM and 0.8% YoY for July versus 0.0% and 0.2% respective priors. That said, the Core PPI reprinted 2.4% yearly figures for the said month compared to 2.3% anticipated. Further, the preliminary readings of the Michigan Consumer Sentiment Index CSI edged lower to 71.2 for August versus 71.6 prior and 71.0 market forecasts. Additionally, UoM 5-year Consumer Inflation Expectations eased to 2.9% for August versus 3.0% expected and prior.
In case of the Fed talks, Federal Reserve (Fed) Governor Michelle Bowman backed additional rate hikes and defended the Fed hawks. However, San Francisco Fed Bank President Mary Daly, Philadelphia Fed Bank President Patrick Harker and New York Fed President John Williams signaled rate cuts in 2024 but also highlighted data-dependency and kept the policy doves looking for more details to confirm the bias.
With this, the CME Group’s Fedwatch tool suggests that traders see less than a 10% chance that the US will raise interest rates in September.
Elsewhere, China allows the local governments to use the provincial-level governments to raise about 1 trillion yuan ($139 billion) via bond sales to repay the debt of local-government financing vehicles (LGFV) and other off-balance sheet issuers, per Bloomberg. The news justifies the market’s confidence in the Chinese policymakers’ capacity to avoid recession and keep a tab on the US Dollar and prod the Gold sellers.
Alternatively, China’s trade surplus improved but downbeat inflation data signaled that the dragon nation’s economic recovery is in danger, which in turn exerted downside pressure on the commodities and Antipodeans, allowing the US Dollar to cheer its haven status and drown the Gold Price.
The fears of witnessing more geopolitical tussles between the West and China, mainly due to the US restriction on investment in China technology companies and the likely repeat of the measures by the UK and European Union, roiled the sentiment and inspired the Gold sellers. Previously, China Commerce Ministry unveiled measures to limit exports of some drones and drone-related equipment, starting from September 01, by citing “national security and interests”. The dragon nation also showed dislike for the US ban on investment in Chinese technology companies by citing the “right to retaliate”, which in turn allowed the XAU/USD bears to stay hopeful.
Not only the US-China fears but Russia’s firing of warning shots at a warship in the Black Sea, which in turn renews the geopolitical woes and exerts more pressure on the Gold Price.
China/US statistics, Fed Minutes to direct XAU/USD moves
With the recently downbeat China data and mixed concerns about the Federal Reserve (Fed) weighing on the Gold Price, the XAU/USD traders will seek more details from the Dragon Nation, as well as from the US, for clear directions.
That said, China’s Industrial Production and Retail Sales for July, up for publishing on Tuesday, will be crucial to watch for initial directions ahead of Wednesday’s housing numbers.
More importantly, Tuesday’s US Retail Sales for July and Wednesday’s Minutes of the latest Federal Open Market Committee (FOMC) monetary policy meeting will be crucial to watch for a better view.
Also read: Gold Price Weekly Forecast: XAU/USD closes in on key support on China slowdown fears
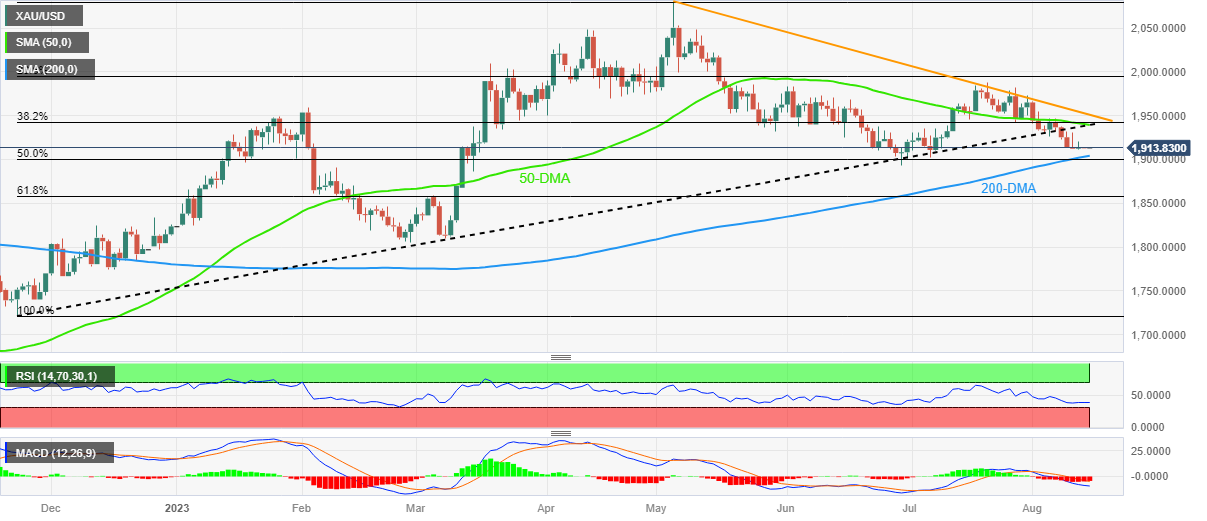
Gold Price Technical Analysis
Gold Price remains on the back foot around $1,910, comprising the 61.8% Fibonacci retracement of late February to early May upside, after witnessing a three-week downtrend.
Adding strength to the bearish bias about the Gold Price is the quote’s clear downside break of an ascending support line from late February, now immediate resistance surrounding $1,925.
Furthermore, the bearish signals from the Moving Average Convergence and Divergence (MACD) indicator also keep the XAU/USD sellers hopeful of witnessing further downside of the bullion.
It’s worth noting, however, that the Relative Strength Index (RSI), placed at 14, stays below 50.0 and suggests bottom-picking of the Gold Price, which in turn highlights the 200-DMA support of around $1,900.
In a case where the XAU/USD breaks the 200-DMA support and stays below the $1,900 round figure, the odds of witnessing a slump to the early March swing high of around $1,858 can’t be ruled out.
On the contrary, a daily closing beyond the support-turned-resistance line stretched from late February, close to $1,925 at the latest, will aim for the $1,941 resistance confluence comprising the 50-DMA and the 50% Fibonacci retracement.
Following that, a downward-sloping resistance line from early May, close to $1,955 by the press time, will act as the final defense of the Gold sellers.
To sum up, the Gold Price remains on the bear’s radar but the quote’s further downside needs validation from the 200-DMA.
Gold Price: Daily chart
Trend: Further downside expected
Author

Anil Panchal
FXStreet
Anil Panchal has nearly 15 years of experience in tracking financial markets. With a keen interest in macroeconomics, Anil aptly tracks global news/updates and stays well-informed about the global financial moves and their implications.


