Gold Price Forecast: XAU/USD traders eye a correction before $1,850


Update: Gold (XAU/USD) is flat in Asia as the markets consolidate the weakness in the greenback from overnight. The bears moved in despite prospects of a March hike taking the DXY index to a lower level of daily support as follows:

The move has left the price of the yellow metal in a bullish territory as follows:

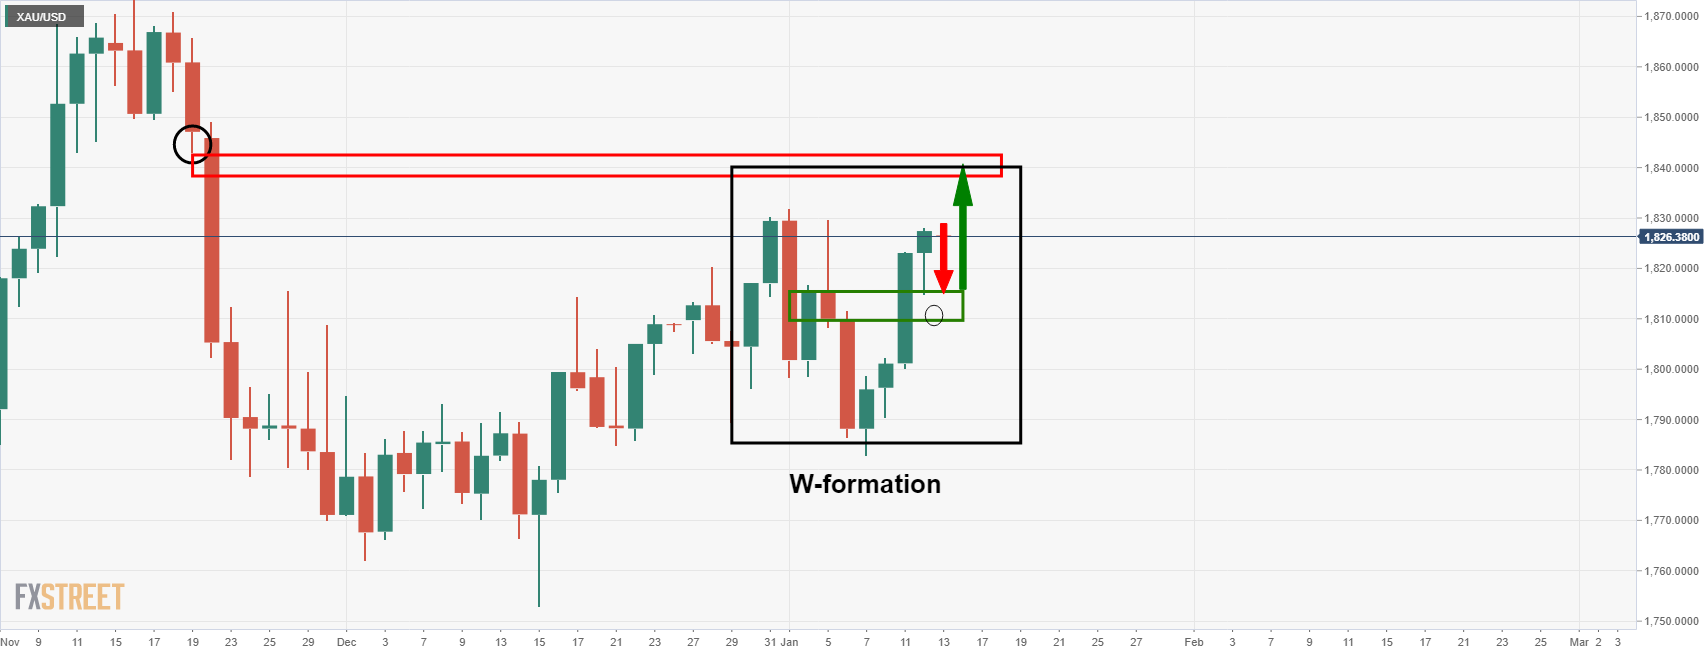
The daily is printing a W-formation, however, so this could lead to a bearish correction to test the neckline support near to 41,815 in the coming sessions. Should this hold, then there will be a ficus on $1,850 again. 

End of update

Gold (XAU/USD) buyers take a breather around the weekly top near $1,825-26 during the initial Asian session on Thursday. The yellow metal refreshed multi-day high on Wednesday after the US Treasury yields and the greenback marked a surprise fall despite a four-decade high inflation data, as well as hawkish Fedspeak.

That said, US CPI jumped to the highest levels since 1982 while matching 7.0% YoY forecasts, up from 6.8% previous readouts. The monthly figures rose to 0.5% versus 0.4% expected but softened below 0.8% prior.

After the US inflation data release, Federal Reserve Bank of St. Louis President James Bullard said, per Wall Street Journal (WSJ), “Four rate hikes in 2022 now appear to be on the table and, in the face of high inflation, a rate hike in March seems likely.” On the same line were comments from, Fed Board of Governors’ member and incoming Vice Chairman of the FOMC Lael Brainard who said, “Inflation control is Fed's most important task. Furthermore, White House Economic Adviser Brian Deese mentioned that supply chain issues are worse than expected, suggesting further inflation pressure.

Elsewhere, Japan witnesses the four-month high daily covid infections and is ready to push Tokyo towards the second highest COVID-19 alert level while Australian policymakers called for a snap Cabinet meeting to tackle the steady jump in the daily infections. Furthermore, the US and Europe aren’t behind the curve while China and India have also started reporting multi-day high daily covid numbers.

That said, the US Dollar Index (DXY) slumped to the lowest levels since November 11, also marking the biggest daily loss in nearly seven weeks. The US Treasury bond yields also marked a surprising extension of the previous weakness, which in turn propelled the Wall Street benchmark before the day-end pullback.

To sum up, the gold prices are likely consolidating November’s losses amid the softer yields and the US dollar. However, the fundamentals are against the bulls and hence incoming catalysts should be given higher attention while expecting a pullback. Among them, weekly prints of US jobless claims, monthly figures of the Producer Price Index (PPI) and Fedspeak can direct intraday moves while Friday’s US Retail Sales will be important too.

Read: Riding out inflation in style

Technical analysis

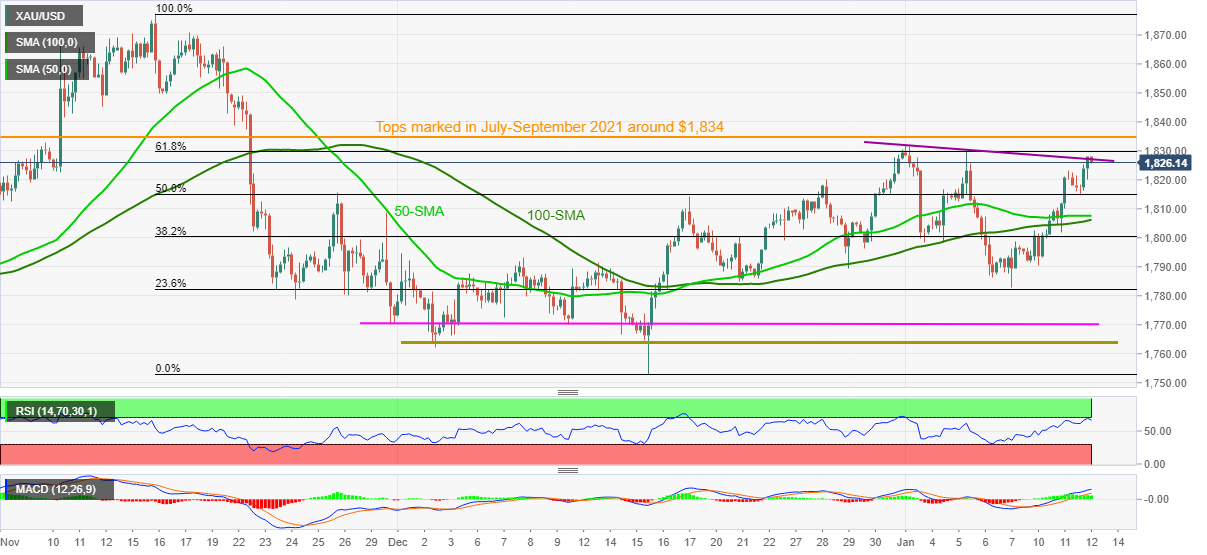
Gold refreshed one-week top post-US inflation data, extending the previous run-up beyond 100 and 50 SMAs. However, a descending resistance line from December 03, around $1,826, restricts the metal’s immediate upside.

Given the key SMA breakout, as well as bullish MACD signals and firmer RSI, gold buyers are likely to overcome the $1,826 immediate hurdle.

Following that, the 61.8% Fibonacci retracement (Fibo.) of November-December downside, near $1,830 and tops marked during July and September around $1,834 will be crucial to watch for gold’s further upside momentum.

Alternatively, pullback moves could eye 50 and 100-SMA region surrounding $1,805-08, a break of which will need validation from the $1,800 threshold to convince gold sellers.

During the quote’s downturn past $1,800, the 23.6% Fibo. level near $1,782, $1,770 and $1,762 will test the gold bears before directing them to December 2021 trough surrounding $1,753.

Gold: Four-hour chart

Trend: Further upside expected

Additional important levels

Overview
Today last price 1825.9
Today Daily Change 2.84
Today Daily Change % 0.16%
Today daily open 1823.06
 
Trends
Daily SMA20 1803.9
Daily SMA50 1805.92
Daily SMA100 1793.19
Daily SMA200 1801.61
 
Levels
Previous Daily High 1823.36
Previous Daily Low 1800.22
Previous Weekly High 1831.91
Previous Weekly Low 1782.93
Previous Monthly High 1830.39
Previous Monthly Low 1753.01
Daily Fibonacci 38.2% 1814.52
Daily Fibonacci 61.8% 1809.06
Daily Pivot Point S1 1807.73
Daily Pivot Point S2 1792.41
Daily Pivot Point S3 1784.59
Daily Pivot Point R1 1830.87
Daily Pivot Point R2 1838.69
Daily Pivot Point R3 1854.01


Share: Feed news

Information on these pages contains forward-looking statements that involve risks and uncertainties. Markets and instruments profiled on this page are for informational purposes only and should not in any way come across as a recommendation to buy or sell in these assets. You should do your own thorough research before making any investment decisions. FXStreet does not in any way guarantee that this information is free from mistakes, errors, or material misstatements. It also does not guarantee that this information is of a timely nature. Investing in Open Markets involves a great deal of risk, including the loss of all or a portion of your investment, as well as emotional distress. All risks, losses and costs associated with investing, including total loss of principal, are your responsibility. The views and opinions expressed in this article are those of the authors and do not necessarily reflect the official policy or position of FXStreet nor its advertisers. The author will not be held responsible for information that is found at the end of links posted on this page.

If not otherwise explicitly mentioned in the body of the article, at the time of writing, the author has no position in any stock mentioned in this article and no business relationship with any company mentioned. The author has not received compensation for writing this article, other than from FXStreet.

FXStreet and the author do not provide personalized recommendations. The author makes no representations as to the accuracy, completeness, or suitability of this information. FXStreet and the author will not be liable for any errors, omissions or any losses, injuries or damages arising from this information and its display or use. Errors and omissions excepted.

The author and FXStreet are not registered investment advisors and nothing in this article is intended to be investment advice.

XM
Account
7.2
Tools
9.2
Service
9.4
Trading
9.0
Trust
7.0
Experience
8.4
Read review
Moneta Markets
Account
7.4
Tools
6.6
Service
8.0
Trading
6.6
Trust
5.2
Experience
9.2
Read review
Trading Pro
Account
7.2
Tools
5.2
Service
6.6
Trading
8.0
Trust
5.0
Experience
7.0
Read review
Pepperstone
Account
8.2
Tools
8.2
Service
7.4
Trading
9.0
Trust
8.8
Experience
9.0
Read review
XM
Read review
Moneta Markets
Read review
Trading Pro
Read review
Pepperstone
Read review
Trading Pro
Read review
Pepperstone
Read review
XM
Read review
Moneta Markets
Read review
Trading Pro
Account
7.2
Tools
5.2
Service
6.6
Trading
8.0
Trust
5.0
Experience
7.0
Read review
Pepperstone
Account
8.2
Tools
8.2
Service
7.4
Trading
9.0
Trust
8.8
Experience
9.0
Read review
XM
Account
7.2
Tools
9.2
Service
9.4
Trading
9.0
Trust
7.0
Experience
8.4
Read review
Moneta Markets
Account
7.4
Tools
6.6
Service
8.0
Trading
6.6
Trust
5.2
Experience
9.2
Read review

Recommended content


Recommended content

Editors’ Picks

EUR/USD keeps the offered bias near 1.1360

EUR/USD keeps the offered bias near 1.1360

EUR/USD remains under pressure in the mid-1.1300s following the press conference by the ECB’s Lagarde on Thursday, all after the central bank matched estimates and unanimously lowered its policy rates at its event.

EUR/USD News
GBP/USD advances to daily highs past 1.3250

GBP/USD advances to daily highs past 1.3250

GBP/USD is picking up extra upside impulse and is revisiting the 1.3250 zone, or daily peaks, as the US Dollar is trimming part of its earlier advance. The move in Cable remains propped up by a firm tone in the risk complex.

GBP/USD News
Gold loses traction and revisits the $3,320 zone

Gold loses traction and revisits the $3,320 zone

Gold burst to another all‑time high, teasing the $3,360 mark per ounce before easing back to the $3,320 zone per troy ounce as the Greeback staged a comeback and Treasury yields firmed across the curve.

Gold News
Crypto market cap fell more than 18% in Q1, wiping out $633.5 billion after Trump’s inauguration top

Crypto market cap fell more than 18% in Q1, wiping out $633.5 billion after Trump’s inauguration top

CoinGecko’s Q1 Crypto Industry Report highlights that the total crypto market capitalization fell by 18.6% in the first quarter, wiping out $633.5 billion after topping on January 18, just a couple of days ahead of US President Donald Trump’s inauguration.

Read more
Future-proofing portfolios: A playbook for tariff and recession risks

Future-proofing portfolios: A playbook for tariff and recession risks

It does seem like we will be talking tariffs for a while. And if tariffs stay — in some shape or form — even after negotiations, we’ll likely be talking about recession too. Higher input costs, persistent inflation, and tighter monetary policy are already weighing on global growth. 

Read more
The Best brokers to trade EUR/USD

The Best brokers to trade EUR/USD

SPONSORED Discover the top brokers for trading EUR/USD in 2025. Our list features brokers with competitive spreads, fast execution, and powerful platforms. Whether you're a beginner or an expert, find the right partner to navigate the dynamic Forex market.

Read More

Forex MAJORS

Cryptocurrencies

Signatures

Best Brokers of 2025