- Gold price is looking to recapture the $1,850.00 resistance despite quiet market mood.
- The USD Index failed to capitalize on escalating geopolitical tensions.
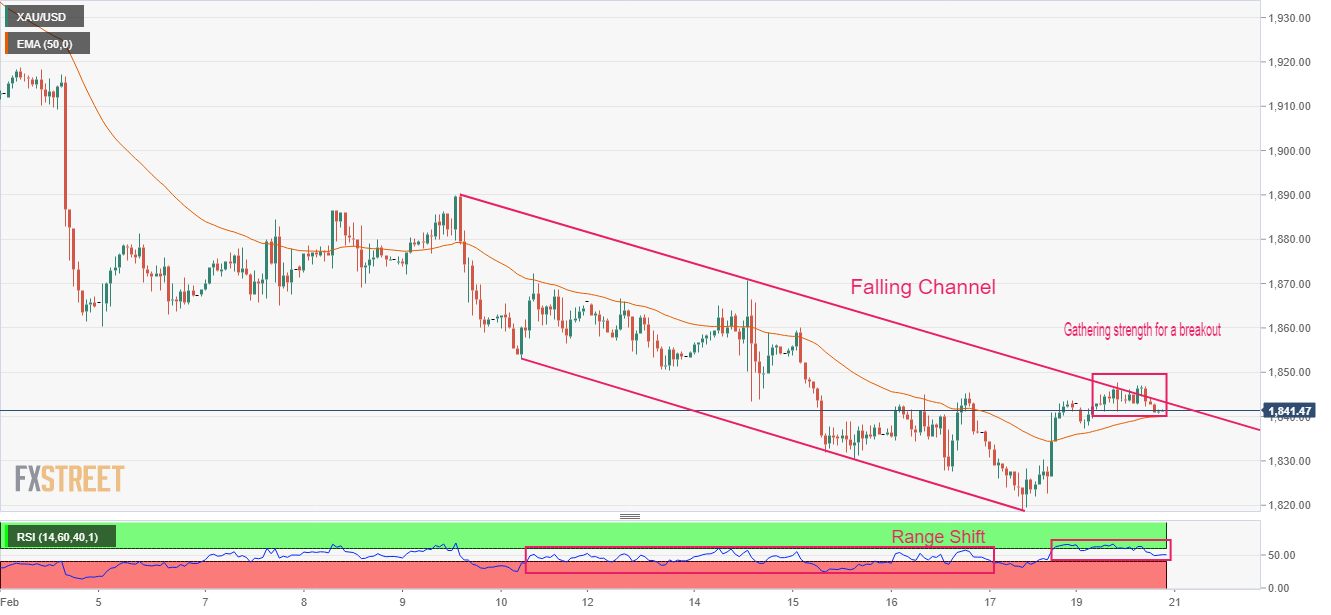
- Gold price is gathering strength to deliver a breakout of the Falling Channel.
Gold price (XAU/USD) has displayed a back-and-forth action in a narrow range above $1,840.00 on Monday’s session. The precious metal is expected to hit the critical resistance of $1,850.00 as investors have digested the fact that the United States inflation could display a surprise rebound after declining consecutively for the past six months.
Last week, the release of the higher-than-anticipated Producer Price Index (PPI) indicated that firms believe that consumer spending is still solid and that wholesale inflation should not be declined extensively. Robust demand from households due to the upbeat labor market is going to keep the expectations of a rebound in the Consumer Price Index (CPI) alive ahead.
Meanwhile, the US Dollar Index (DXY) managed to safeguard the critical support of 103.50. The USD Index didn’t pick strength despite rising geopolitical tensions. The market mood was quiet as the US markets were closed on account of Presidents’ Day. S&P500 futures displayed a volatile session amid uncertainty inspired by an elongated weekend.
For further guidance, investors will focus on the preliminary S&P PMI (Feb) data, which will release on Tuesday. The preliminary Manufacturing PMI (Feb) is seen lower at 46.8 vs. the prior release of 46.9. And the Services PMI is seen at 46.6 against the former release of 46.8.
Gold technical analysis
Gold price is oscillating near the upper end of the Falling Channel chart pattern on an hourly scale. The precious metal is gathering strength to deliver a breakout for a fresh upside. A breakout of the aforementioned chart pattern indicates a bullish reversal. The 50-period Exponential Moving Average (EMA) at $1,840.00 is acting as major support for the Gold bulls.
Meanwhile, the Relative Strength Index (RSI) (14) has demonstrated a range shift structure. The RSI (14) has shifted its structure from the bearish segment of 20.00-60.00 to the bullish arena of 40.00-60.00, in which the 40.00 will act as a support for the US Dollar bulls.
Gold hourly chart
Information on these pages contains forward-looking statements that involve risks and uncertainties. Markets and instruments profiled on this page are for informational purposes only and should not in any way come across as a recommendation to buy or sell in these assets. You should do your own thorough research before making any investment decisions. FXStreet does not in any way guarantee that this information is free from mistakes, errors, or material misstatements. It also does not guarantee that this information is of a timely nature. Investing in Open Markets involves a great deal of risk, including the loss of all or a portion of your investment, as well as emotional distress. All risks, losses and costs associated with investing, including total loss of principal, are your responsibility. The views and opinions expressed in this article are those of the authors and do not necessarily reflect the official policy or position of FXStreet nor its advertisers. The author will not be held responsible for information that is found at the end of links posted on this page.
If not otherwise explicitly mentioned in the body of the article, at the time of writing, the author has no position in any stock mentioned in this article and no business relationship with any company mentioned. The author has not received compensation for writing this article, other than from FXStreet.
FXStreet and the author do not provide personalized recommendations. The author makes no representations as to the accuracy, completeness, or suitability of this information. FXStreet and the author will not be liable for any errors, omissions or any losses, injuries or damages arising from this information and its display or use. Errors and omissions excepted.
The author and FXStreet are not registered investment advisors and nothing in this article is intended to be investment advice.


Recommended content
Editors’ Picks

EUR/USD holds losses below 1.1400 amid US Dollar recovery
EUR/USD remains pressured below 1.1400 in the European trading hours on Tuesday. The Euro weakens amid rising expectations of further ECB interest rate cuts while the US Dollar draws support from some progress on US trade deals with its major global trading partners. US jobs data awaited.

GBP/USD retreats to near 1.3400 ahead of BoE’s Ramsden speech
GBP/USD is holding its pullback from three-year highs of 1.3445 early Tuesday, pressured by a modest US Dollar rebound and a cautious market mood. Investors look to BoE policymaker Ramsden's speech and US jobs and consumer sentiment data for fresh trading impetus.

Gold price retains negative bias amid positive risk tone and reviving USD demand
Gold price remains heavily offered through the early European session, though it manages to hold above the $3,300 mark amid mixed fundamental cues. Signs of easing US-China trade tensions continue to drive flows away from traditional safe-haven assets and undermine demand for the precious metal.

Tether Bitcoin stash crosses 100,000, stablecoin giant holds 7.7 tons of physical Gold
Tether, a stablecoin giant and the seventh-largest holder of US Treasury bills, published its attestation report for the first quarter on Monday. The stablecoin firm noted the US Dollar’s (USD) dominance in the stablecoin sector and dropped the statistics on its physical Gold reserves.

Week ahead: US GDP, inflation and jobs in focus amid tariff mess – BoJ meets
Barrage of US data to shed light on US economy as tariff war heats up. GDP, PCE inflation and nonfarm payrolls reports to headline the week. Bank of Japan to hold rates but may downgrade growth outlook. Eurozone and Australian CPI also on the agenda, Canadians go to the polls.

The Best brokers to trade EUR/USD
SPONSORED Discover the top brokers for trading EUR/USD in 2025. Our list features brokers with competitive spreads, fast execution, and powerful platforms. Whether you're a beginner or an expert, find the right partner to navigate the dynamic Forex market.