Gold Price Forecast: XAU/USD approaches $1,650 as risk-off mood moderates, hawkish Fed bets soar
- Gold price has rebounded after dropping to near $1,640.00 as the risk-off impulse eases.
- A 75 bps rate hike by the Fed looks certain, as the odds have reached almost 100%.
- Soaring odds for hawkish Fed have pushed 10-year yields above 4%.

Gold price (XAU/USD) has sensed a buying interest after dropping to near $1,640.00 in the Tokyo session. The precious metal has witnessed a loss in the downside momentum, and a rebound move has played in, which is approaching $1,650.00.
The rebound move has developed as the risk-off sentiment has been eased for a while as investors have already discounted the expectations of a 75 basis point (bps) rate hike by the Federal Reserve (Fed). The US dollar index (DXY) oscillates around 113.30 after a firmer rebound from 112.20. Also, the 10-year US Treasury yields are above 4% on soaring bets for a hawkish Fed ahead.
Per the CME FedWatch tool, the chances of an increment in the interest rates by 75 bps consecutive for the fourth time stand at 99.4% at the press time. The odds of continuation of a more significant rate have jumped after the release of higher-than-expected US Consumer Price Index (CPI) data released last week. The headline US CPI landed higher at 8.2% than the projections of 8.1% but lower than the prior release of 8.3%. While the core CPI advanced to 6.6% vs the expectations of 6.5%.
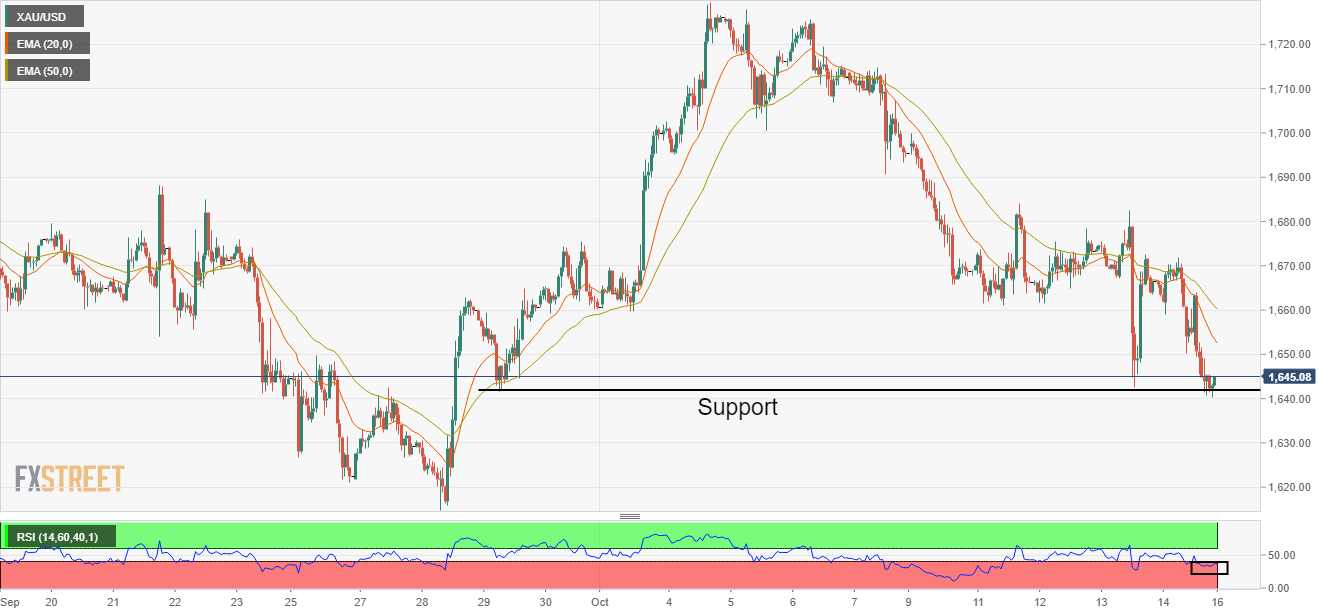
Gold technical analysis
The gold price has picked demand after dropping to near the horizontal support plotted from Sep 29 low at $1,641.59. The 20-and 50-Exponential Moving Averages (EMAs) are declining at $1,652.68 and $1,660.00, which adds to the downside filters.
Also, the Relative Strength Index (RSI) (14) oscillates in a bearish range of 20.00-40.00, favouring more weakness ahead.
Gold hourly chart
Author

Sagar Dua
FXStreet
Sagar Dua is associated with the financial markets from his college days. Along with pursuing post-graduation in Commerce in 2014, he started his markets training with chart analysis.


