- Gold price is looking to shift its business above $1,840.00 after an Ascending Triangle breakout.
- The US Dollar Index has attempted a recovery after dropping to near 103.15.
- Higher interest rates by the Fed could be responsible for weaker consensus for US ISM PMI data.
Gold price (XAU/USD) has displayed a sheer north-side move after surpassing the critical resistance of $1,823.00 in the Asian session. The precious metal is aiming to shift its auction profile above the $1,840.00 resistance amid a decline in safe-haven’s appeal.
A sheer recovery move in the S&P500 futures has shifted the traction towards the risk appetite theme. Meanwhile, the US Dollar Index (DXY) has attempted a rebound after dropping to near the crucial support at 103.15. Investors should brace for volatility in the FX domain ahead of the release of Wednesday’s United States ISM Manufacturing PMI data (Dec). According to the estimates, the economic data will drop to 48.5 vs. the former release of 49.0.
The reasoning behind lower consensus for ISM PMI data could be the higher interest rates by the Federal Reserve (Fed) due to which firms have postponed their expansion plans to avoid higher interest obligations.
Apart from the Manufacturing PMI, the release of the Federal Open Market Committee (FOMC) minutes will hog the limelight. Investors will keenly observe the economic projections and cues about the monetary policy outlook for CY2023.
Gold technical analysis
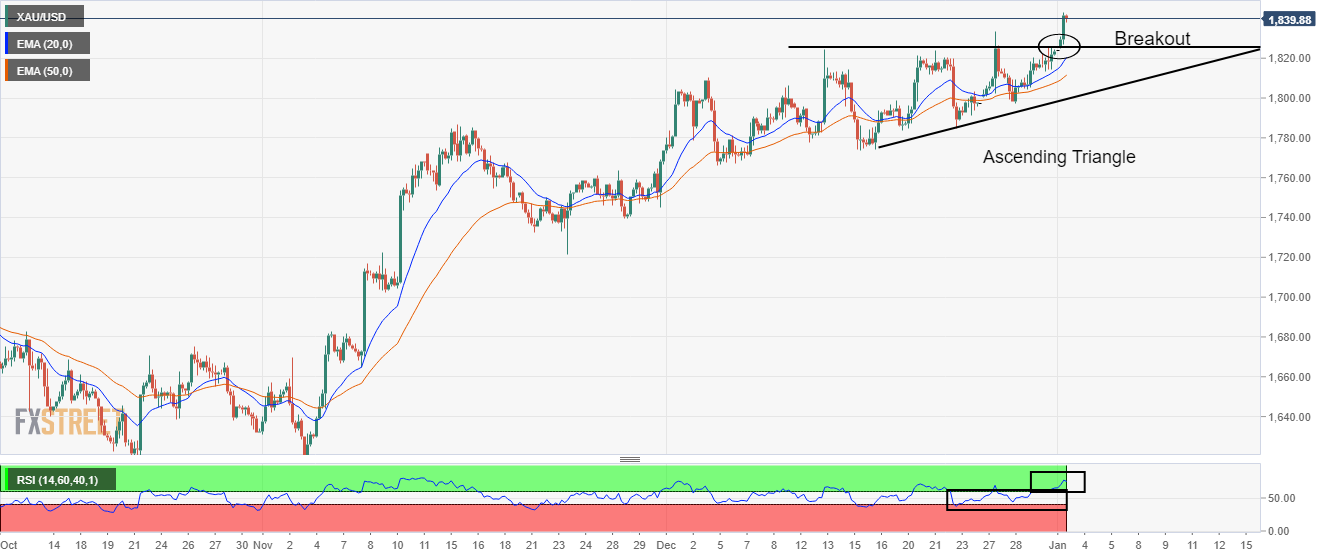
Gold price has delivered a breakout of the Ascending Triangle chart pattern formed on a four-hour scale. The horizontal resistance of the aforementioned chart pattern is placed from December 13 high at $1,824.55 while the upward-sloping trendline is plotted from December 16 low at $1,774.36.
Advancing 20-and 50-period Exponential Moving Averages (EMAs) at $1,820.00 and $1,812.07 respectively add to the upside filters.
Meanwhile, the Relative Strength Index (RSI) (14) has shifted into the bullish range of 60.00-80.00 from the 40.00-60.00 range, which indicates more upside ahead.
Gold four-hour chart
Information on these pages contains forward-looking statements that involve risks and uncertainties. Markets and instruments profiled on this page are for informational purposes only and should not in any way come across as a recommendation to buy or sell in these assets. You should do your own thorough research before making any investment decisions. FXStreet does not in any way guarantee that this information is free from mistakes, errors, or material misstatements. It also does not guarantee that this information is of a timely nature. Investing in Open Markets involves a great deal of risk, including the loss of all or a portion of your investment, as well as emotional distress. All risks, losses and costs associated with investing, including total loss of principal, are your responsibility. The views and opinions expressed in this article are those of the authors and do not necessarily reflect the official policy or position of FXStreet nor its advertisers. The author will not be held responsible for information that is found at the end of links posted on this page.
If not otherwise explicitly mentioned in the body of the article, at the time of writing, the author has no position in any stock mentioned in this article and no business relationship with any company mentioned. The author has not received compensation for writing this article, other than from FXStreet.
FXStreet and the author do not provide personalized recommendations. The author makes no representations as to the accuracy, completeness, or suitability of this information. FXStreet and the author will not be liable for any errors, omissions or any losses, injuries or damages arising from this information and its display or use. Errors and omissions excepted.
The author and FXStreet are not registered investment advisors and nothing in this article is intended to be investment advice.


Recommended content
Editors’ Picks

AUD/USD: A challenge of the 2025 peaks looms closer
AUD/USD rose further, coming closer to the key resistance zone around 0.6400 despite the strong rebound in the Greenback and the mixed performance in the risk-associated universe. The pair’s solid price action was also propped up by a firm jobs report in Oz.

EUR/USD: Extra gains likely above 1.1400
EUR/USD came under renewed downside pressure following another bull run to the 1.1400 region on Thursday. The knee-jerk in spot came in response to the decent bounce in the US Dollar, while the dovish tone from the ECB’s Lagarde seems to have also contributed to the bearish developments in the pair.

Gold bounces off daily lows, back near $3,320
The prevailing risk-on mood among traders challenges the metal’s recent gains and prompts a modest knee-jerk in its prices on Thursday. After bottoming out near the $3,280 zone per troy ounce, Gold prices are now reclaiming the $3,320 area in spite of the stronger Greenback.

Canada launches world's first Solana ETF as $270M in staking deposits propel SOL price above BTC and ETH
Solana price jumps on Thursday as Canadian firm launches the world’s first SOL ETF, fueling bullish sentiment alongside $270 million in new staking deposits this week.

Future-proofing portfolios: A playbook for tariff and recession risks
It does seem like we will be talking tariffs for a while. And if tariffs stay — in some shape or form — even after negotiations, we’ll likely be talking about recession too. Higher input costs, persistent inflation, and tighter monetary policy are already weighing on global growth.

The Best brokers to trade EUR/USD
SPONSORED Discover the top brokers for trading EUR/USD in 2025. Our list features brokers with competitive spreads, fast execution, and powerful platforms. Whether you're a beginner or an expert, find the right partner to navigate the dynamic Forex market.