- Gold price is treading water amid a cautious market mood after the recent slump.
- Traders remain on the sidelines ahead of ECB, US inflation and Russia-Ukraine peace talks.
- Gold: Is the correction over yet? Watch out for the critical levels.
Gold price is stabilizing at lower levels, nursing heavy losses incurred on Wednesday A sudden wave of optimism hit gold price hard after Ukraine said it is ready for a comprise if Russia shows the same intent. Although markets are back to square one this Thursday, as the Ukraine crisis is unlikely to get over anytime soon. Heightened uncertainty could likely keep a floor under gold price. But traders may refrain from placing any positional bets on gold price ahead of the ECB announcements, US inflation and the much-awaited outcome of the Russia-Ukraine peace talks.
Read: War and inflation
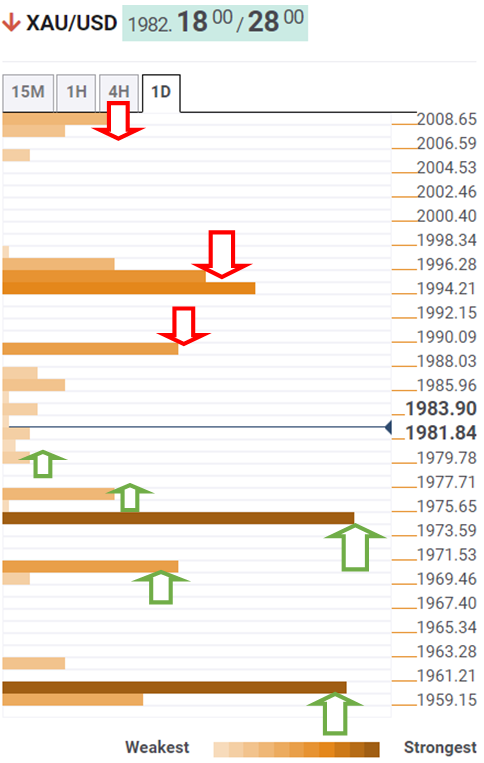
Gold Price: Key levels to watch
The Technical Confluences Detector shows that gold price is gyrating below powerful resistance at $1,989, which is the meeting point of the SMA5 one-day and the previous high four-hour.
Acceptance above the latter will prompt bulls to take on the dense cluster of resistance levels around $1,996, where the pivot point one-week R1, Fibonacci 23.6% one-day and pivot point one-month R1 coincide.
The next upside target is seen at the $2,000 psychological level, above which a fresh advance towards $2,007 cannot be ruled out. That level is the confluence of the Bollinger Band four-hour Middle and the Fibonacci 38.2% one-day.
Alternatively, decent support awaits around $1,981, a breach of which will call for a retest of the previous day’s low of $1,976.
If the selling pressure intensifies, then gold bears will challenge the previous month’s high near $1,974.
The previous week high of $1,970 will be next on the sellers’ radars. The last line of defense for gold optimists is seen at $1,960, which is the intersection of the previous year’s high and the pivot point one-day S1.
Despite these relevant support and resistance levels, volatility is likely to remain sky-high amid the peace talks, with wild swings in either direction likely on the table.
Here is how it looks on the tool
About Technical Confluences Detector
The TCD (Technical Confluences Detector) is a tool to locate and point out those price levels where there is a congestion of indicators, moving averages, Fibonacci levels, Pivot Points, etc. If you are a short-term trader, you will find entry points for counter-trend strategies and hunt a few points at a time. If you are a medium-to-long-term trader, this tool will allow you to know in advance the price levels where a medium-to-long-term trend may stop and rest, where to unwind positions, or where to increase your position size.
Information on these pages contains forward-looking statements that involve risks and uncertainties. Markets and instruments profiled on this page are for informational purposes only and should not in any way come across as a recommendation to buy or sell in these assets. You should do your own thorough research before making any investment decisions. FXStreet does not in any way guarantee that this information is free from mistakes, errors, or material misstatements. It also does not guarantee that this information is of a timely nature. Investing in Open Markets involves a great deal of risk, including the loss of all or a portion of your investment, as well as emotional distress. All risks, losses and costs associated with investing, including total loss of principal, are your responsibility. The views and opinions expressed in this article are those of the authors and do not necessarily reflect the official policy or position of FXStreet nor its advertisers. The author will not be held responsible for information that is found at the end of links posted on this page.
If not otherwise explicitly mentioned in the body of the article, at the time of writing, the author has no position in any stock mentioned in this article and no business relationship with any company mentioned. The author has not received compensation for writing this article, other than from FXStreet.
FXStreet and the author do not provide personalized recommendations. The author makes no representations as to the accuracy, completeness, or suitability of this information. FXStreet and the author will not be liable for any errors, omissions or any losses, injuries or damages arising from this information and its display or use. Errors and omissions excepted.
The author and FXStreet are not registered investment advisors and nothing in this article is intended to be investment advice.


Recommended content
Editors’ Picks

EUR/USD falls toward 1.1400 after soft Eurozone inflation data
EUR/USD keeps the red near 1.1400 in European trading on Tuesday. The data from the Eurozone showed that the annual HICP inflation softened to 1.9% in May from 2.2% in April, weighing on the Euro. Meanwhile, the broad-based USD recovery ahead of key job openings data from the US drag the pair lower.

GBP/USD retreats toward 1.3500 as BoE policymakers testify
GBP/USD stays under modest bearish pressure and declines toward 1.3500 in the European session on Tuesday. While testifying before Parliament, BoE Governor Bailey noted that they have not seen inflation surprises and reiterated that they need to approach policy-easing in a gradual and cautious way.

Gold price retains its negative bias as goodish USD rebound overshadows weaker risk tone
Gold price maintains its offered tone below a four-week top touched earlier this Tuesday though it has managed to rebound slightly from the daily low set during the first half of the European session. The intraday slide is sponsored by the emergence of some US Dollar buying, which tends to undermine demand for the commodity.

Crypto Gainers WIF, SPX, HYPE: Meme coins soar with Bitcoin’s recovery to $106K
Crypto market bounces back as Bitcoin (BTC) reclaims the $106,000 level at press time on Tuesday, resulting in a refreshed rally in top meme coins such as Dogwifhat (WIF) and SPX6900 (SPX), and Pepe (PEPE).

AUD/USD turns lower toward 0.6450 after RBA Minues, poor China's PMI
AUD/USD is meeting fresh supply toward 0.6450 in the Asian session on Tuesday as traders digest the RBA Minutes and the unexpected contraction in China's May Caixin Manufacturing PMI. Additionally, a modest US Dollar rebound keeps the pair undermined.

The Best brokers to trade EUR/USD
SPONSORED Discover the top brokers for trading EUR/USD in 2025. Our list features brokers with competitive spreads, fast execution, and powerful platforms. Whether you're a beginner or an expert, find the right partner to navigate the dynamic Forex market.