Gold Price Forecast: Fed inflation may hinder XAU/USD bulls' approach to $1,970 – Confluence Detector
- Gold Price remains firmer at multi-day high, lacks follow-through of late.
- Sustained trading beyond key support confluence, dovish bias about Fed keep XAU/USD bulls hopeful.
- Mixed updates from China, US Dollar’s lackluster moves prod the Gold Price upside.
- US Core PCE Price Index becomes crucial to watch for clear directions ahead of NFP.

Gold Price (XAU/USD) holds steady at the highest level in four weeks during a four-day winning streak as market players await the key inflation clues from the US and Eurozone. That said, the recently downbeat US data have raised concerns about the Federal Reserve’s (Fed) policy pivot and bolstered the XAU/USD price. On the same line could be the hopes of witnessing more stimulus from the key customer China. However, the cautious mood ahead of the top-tier data and mixed activity numbers from China prod the Gold buyers hopeful.
Looking ahead, the Eurozone CPI and HICP numbers for August will join the risk catalysts to entertain the XAU/USD traders. However, major attention will be given to the US Core Personal Consumption Expenditure (PCE) Price Index for August, expected to remain unchanged at 0.2% MoM but edge higher to 4.2% YoY from 4.1% prior. Should the US inflation gauge ease, the Gold buyers will seek softer clues from the Nonfarm Payrolls (NFP) to confirm an end to the Fed’s hawkish cycle, which in turn can propel the XAU/USD price.
Also read: Gold Price Forecast: XAU/USD looks to US PCE inflation and 100 DMA for further upside
Gold Price: Key levels to watch
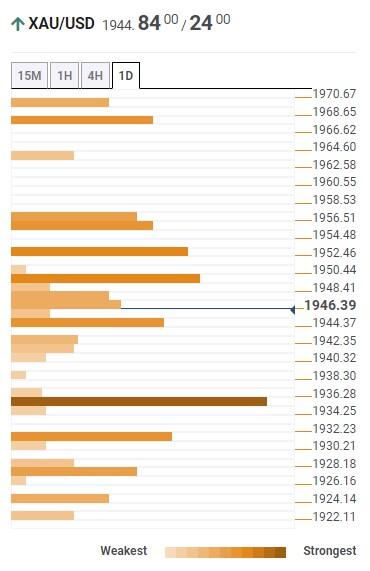
Our Technical Confluence indicator signals that the Gold Price floats firmly beyond the $1,935–36 support confluence, suggesting further upside to track. That said, the stated key support comprises the Pivot Point one-day S1 and Fibonacci 61.8% on one-month.
Also restricting the short-term downside of the XAU/USD is the $1,930 level encompassing the 50-DMA and Pivot Point one-week R1.
Following that, a convergence of the Fibonacci 161.8% on one-day will join the Pivot Point one-day S2 to highlight $1,925 as the last defense of the Gold buyers.
On the flip side, the upper band of the Bollinger on the daily chart and Pivot Point one-day R1 restricts the immediate upside of the Gold Price near $1,950.
More importantly, the 100-DMA and Pivot Point one-day R2, close to $1,957–58, appears a tough nut to crack for the XAU/USD bulls before rushing towards the Fibonacci 23.6% on one-month surrounding $1,970.
Overall, the Gold Price has fewer barriers toward the north but the US inflation data can test the bulls.
Here is how it looks on the tool
About Technical Confluences Detector
The TCD (Technical Confluences Detector) is a tool to locate and point out those price levels where there is a congestion of indicators, moving averages, Fibonacci levels, Pivot Points, etc. If you are a short-term trader, you will find entry points for counter-trend strategies and hunt a few points at a time. If you are a medium-to-long-term trader, this tool will allow you to know in advance the price levels where a medium-to-long-term trend may stop and rest, where to unwind positions, or where to increase your position size.
Author

Anil Panchal
FXStreet
Anil Panchal has nearly 15 years of experience in tracking financial markets. With a keen interest in macroeconomics, Anil aptly tracks global news/updates and stays well-informed about the global financial moves and their implications.


