Gold Price Forecast: XAU/USD drops below $1,800 as DXY snaps two-day downtrend
- Gold holds on above the psychological $1800 level in the count down to Fed's Powell on Friday.
- The US dollar is consolidating ahead of the event, licking would at critical support in DXY near 92.80.

Update: Gold (XAU/USD) extend the previous day’s weakness to refresh intraday low around $1,795, down 0.45% on a day during early Wednesday. In doing so, the yellow metal bears the burden of the US Dollar Index (DXY) rebound amid a sluggish Asian session.
Behind the DXY run-up to regain 93.00 level could be the market’s cautious mood ahead of the key Jackson Hole Symposium as well as today’s important data, namely the US Durable Goods Orders for July, forecast -0.3% versus +0.9% prior.
Additionally, worsening virus conditions in the developed nations also weigh on the gold prices. Australia refreshes record infections while New Zealand’s covid cases and the US hospitalizations also jump of late. It’s worth noting that vaccine optimism is the key to battle the pandemic but many top-tier economies do struggle over jabbing.
Hence, the covid woes and pre-data/event mood can underpin the US dollar’s safe-haven demand, which in turn may favor the gold prices.
Gold edged higher on Tuesday and is now sitting comfortably between critical levels of support and resistance on the charts.
Risk sentiment has improved with investors noting a potential apex in the rising cases of the highly contagious delta variant.
Gold is currently trading where it left off at the Wall Street close, near to $1,805 within a $1,800.86 / $1,809.60 range which has narrowed in a new day on Wednesday between $1,801.99 / $1,803.12 so far.
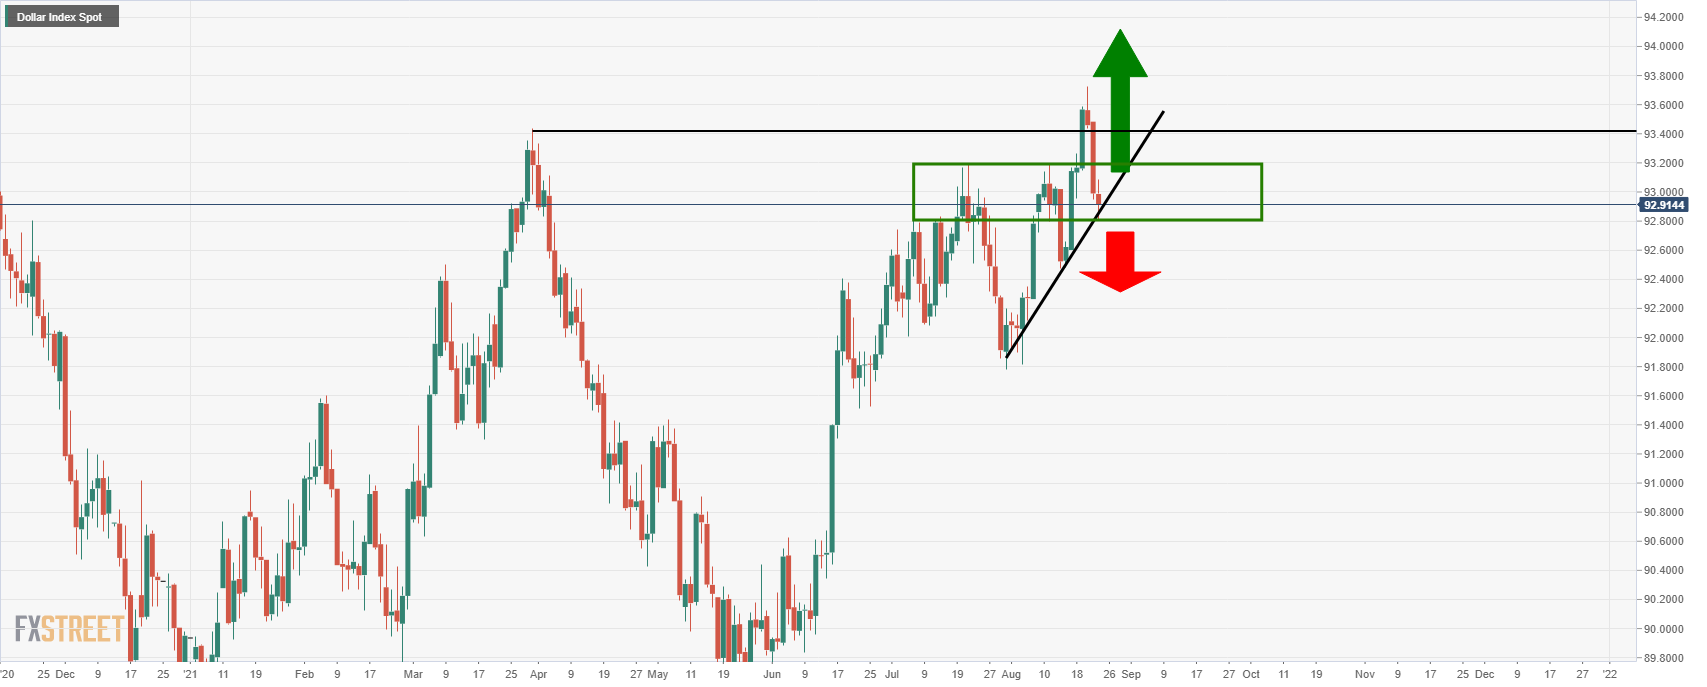
The US dollar has been held back this week, bounded by a rising supporting trendline near 92.80 and the 93.725 highs printed last week, (see DXY technical analysis below).
With that being said, much will depend on the outcome of this Friday’s keynote speech from the Federal Reserve’s chairman, Jerome Powell at the Jackson Hole.
Traders are keenly waiting on Powell's speech for the next cues on taper.
In doing so, this could spark a mini taper-tantrum which would be expected to support the greenback and weigh on all assets linked to risk appetite, such as precious metals.
On the other hand, the Fed has done a very good job in communicating to markets throughout the pandemic and as such, the same would be expected from the Jackson Hole.
On that front, analysts at TD Securities see ''little chance of an announcement and instead expects the Chair's speech to echo the latest July meeting minutes, suggesting that QE tapering is likely by year-end, but don’t expect a September announcement.''
''This leaves November and December as likely timelines for the taper announcement,'' the analysts argued.
Indeed, a larger majority of the market now expects a relatively benign outcome from the event.
This would leave the status quo in play and should be supportive of gold as we count down to more US data ahead of the September Fed meeting.
On the other hand, a surprise hawkish outcome, or official announcements of tapering could set off a mini taper tantrum in the bonds.
This would be expected to translate into higher US yields, upside pressure in the greenback and weigh on precious metals.
With that being said, much of the tapering expectations may have already been priced in. The timings of the tapering is neither here nor there.
The markets are looking for clarity as investors try to second guess actually lift-off in terms of rate hikes. Tapering only starts a long countdown to rate hikes.
The taper tantrum in 2013 did not actually transpire into a significant nor long-lasting bid in the US dollar.
On May 22 2013, the then-Fed Chairman Ben Bernanke stated in testimony before Congress that the Fed may taper the size of its bond-buying program.
This caused an initial but very short-lived rally in the DXY, ending the day around 1% higher before it eventually started to fall several days later, ending the month of May nearly 5% from the post-Bernanke taper comment highs.
However, the S&P 500 fell 3% over the course of just two sessions.
It wasn't until December 18 2013 that the Fed announced that it would start to taper its aggressive bond-buying program to $75 billion a month beginning in January, propelling the market to a record close.
Meanwhile, the DXY did not start to take off until the late summer of 2014 when expectations of rate rises finally began to be priced into the market at a time when the rest of the world's central banks were diverging from the Fed's tightening path.
All in all, this time around, there is a long road ahead and plenty of speed bumps along the way.
However, so long as the US dollar smile theory continues to play out, central bank divergence should keep the greenback underpinned which is a potential headwind for gold prices.
US data will be critical in the coming weeks ahead of the September Fed meeting and likely be the driver for the final quarter of the year.
Gold & DXY technical analysis
DXY technical analysis
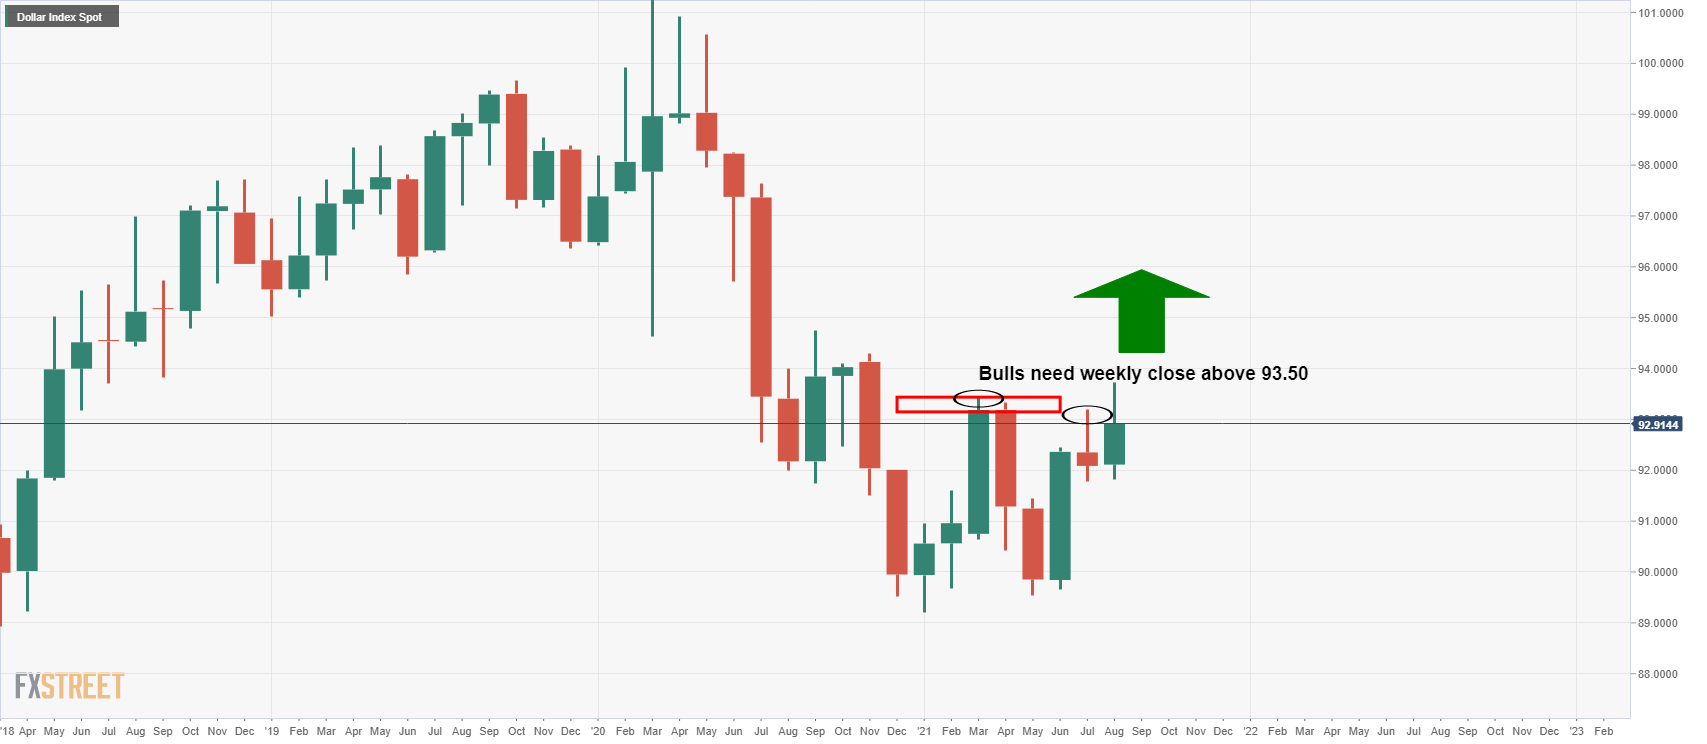
As per the analysis, US dollar at make or break point, countdown to taper, the US dollar bulls need the price to close above 93.50 from a longer-term perspective.
''In doing so, it will have cleared the long term resistance structure, including the weekly 200-SSMA, which marks the line between bullish and bearish territory.
From a daily perspective, the bears will be in play again on a break of trendline support and horizontal structure below 92.80:
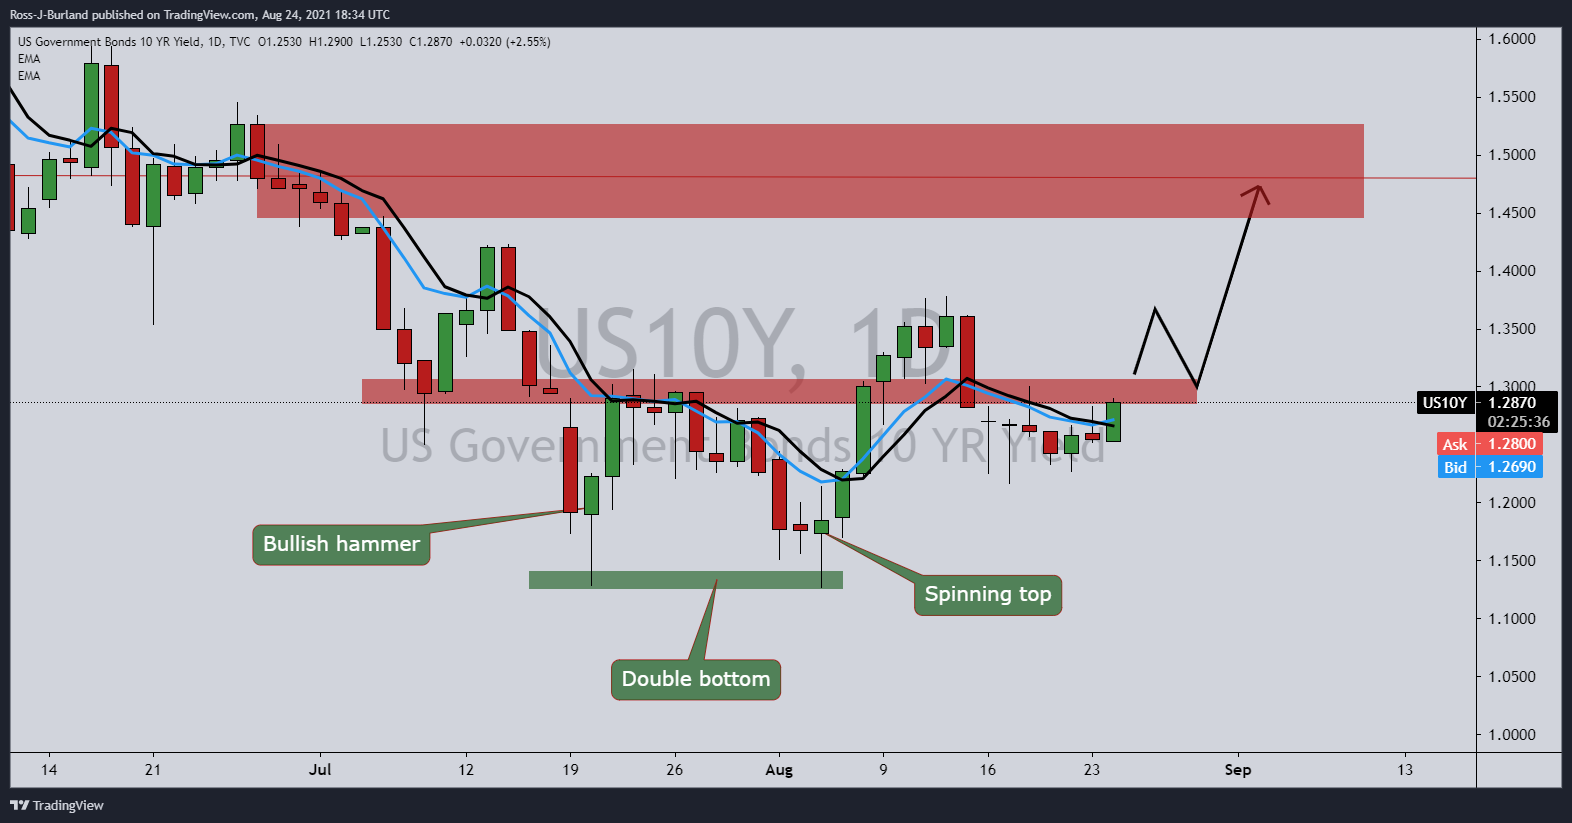
For bulls, at least for the near term, it will be imperative that US 10 year yields extend beyond 1.3020% daily resistance and break ice above 1.3810% to confirm the bullish bottoming candle formations.
We have a bullish hammer printed on July 20, followed by a double bottom on Aug 4, although this was followed by a failure of a restest of old resistance structure near 1.2950/1.3030:
Gold analysis
Meanwhile, on a daily basis, the gold price will need to break 1,810 before any conviction can be given to the rally.
However, if 92.80 breaks in DXY, exposing 92.50 as the last defence, then gold can take off beyond 1,810, leaving the precious metal in good stead for the foreseeable future:
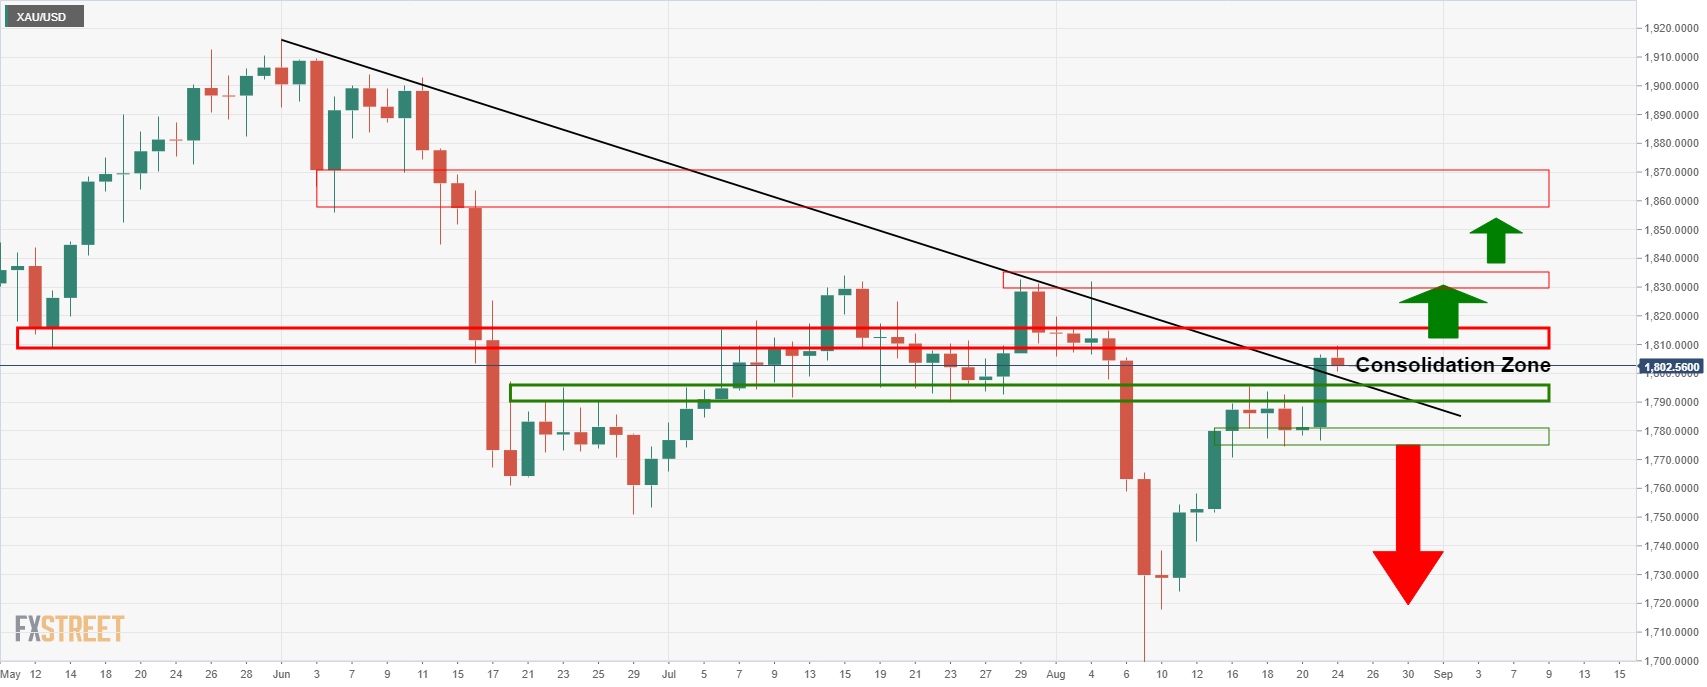
This will see the price closing above both the daily dynamic trendline, the weekly horizontal and counter-trendline resistance between 1,810/20.
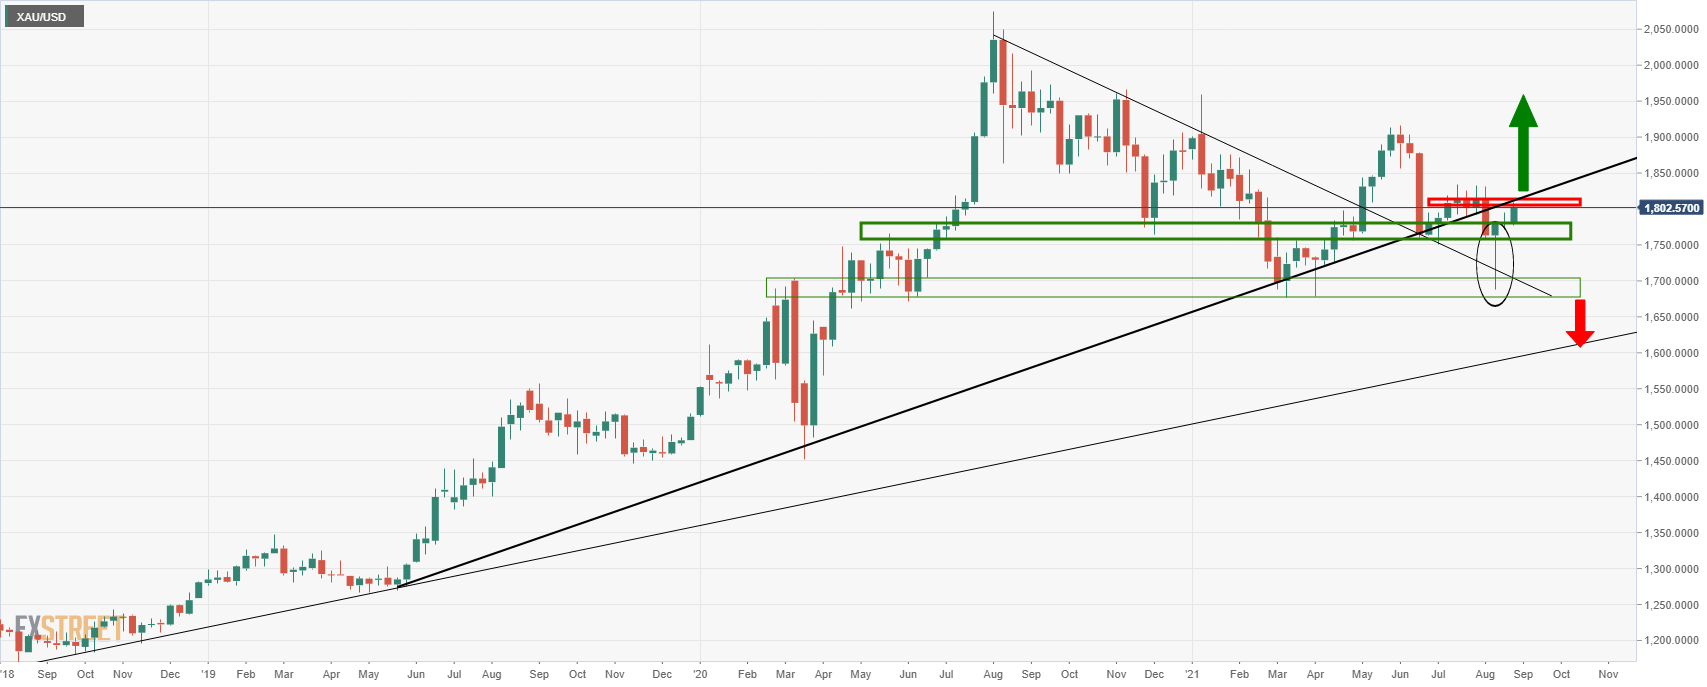
In doing so, it would likely be the foundations for an upside continuation towards prior daily highs near 1,830 and then 1,900.
On the flip side, if the US dollar does break higher, then the gold will most probably fall from the weekly counter-trendline resistance and expose 1,700 and then 1,677 August lows again.
Author

Ross J Burland
FXStreet
Ross J Burland, born in England, UK, is a sportsman at heart. He played Rugby and Judo for his county, Kent and the South East of England Rugby team.


