Gold Price Analysis: XAU/USD’s bearish bias intact while below critical $1850 hurdle – Confluence Detector

Gold (XAU/USD) wavers within familiar ranges above the $1800 level, mainly supported by broad-based US dollar weakness, in response to the coronavirus vaccine-driven global optimism. The US FDA gave a green light to Pfizer’s vaccine early Thursday, with authorization expected within days.
Weak US jobs data also added to the downward pressure on the greenback, keeping a floor under the yellow metal. However, gold's upside appears elusive amid the US fiscal stimulus stalemate and ongoing ETF outflows.
Meanwhile, the XAU sellers continue to lurk at the long-held support now resistance at $1850. Let’s take a deeper look into the technical charts for key levels of note.
Gold Price Chart: Key resistances and supports
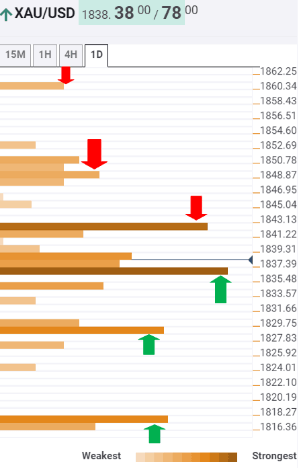
The Technical Confluences Indicator shows that the XAU/USD pair is holding above strong support at $1836, which is the confluence of the previous low one-hour, SMA200 one-hour and SMA5 four-hour.
The next significant cushion awaits at $1828, the meeting point of the Fibonacci 23.6% one-week and the previous day low.
A breach of the last could trigger a sharp drop towards the $1818 support area, which is the Pivot Point one-day S2.
Alternatively, the gold buyers need to find a sustained break above the immediate barrier placed at $1842 to take on the upside once again. That level is the intersection of the Fibonacci 61.8% one-day and 38.2% one-month.
Further up, a dense cluster of healthy resistance levels is seen around $1850, which is the convergence of the previous week high, the previous day high, SMA5 one-day and SMA100 one-hour.
The Pivot Point one-day R2 at $1861 will then challenge the bulls’ commitment.
Here is how it looks on the tool
About Confluence Detector
The TCI (Technical Confluences Indicator) is a tool to locate and point out those price levels where there is a congestion of indicators, moving averages, Fibonacci levels, Pivot Points, etc. Knowing where these congestion points are located is very useful for the trader, and can be used as a basis for different strategies.
Author

Dhwani Mehta
FXStreet
Residing in Mumbai (India), Dhwani is a Senior Analyst and Manager of the Asian session at FXStreet. She has over 10 years of experience in analyzing and covering the global financial markets, with specialization in Forex and commodities markets.


