|

Gold Price Analysis: XAU/USD teases inverse head-and-shoulders on 1H below $1,900

  • Gold remains underpinned, keeps Friday’s recovery moves.
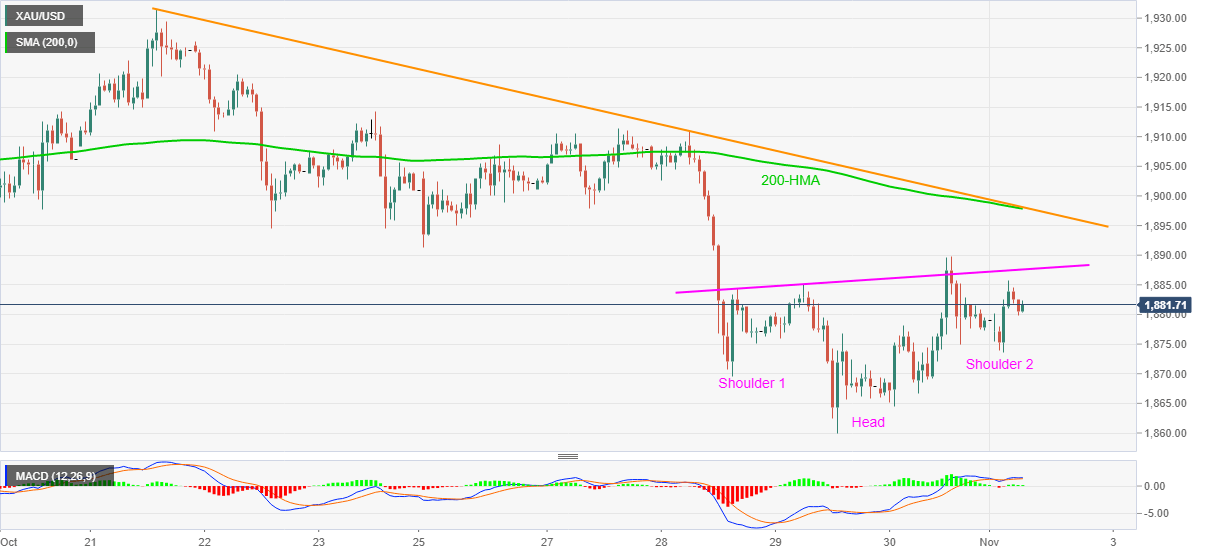
  • 200-HMA, eight-day-old resistance line offers tough resistance following the confirmation of a bullish chart pattern.
  • September lows can entertain short-term bears before highlighting early-July top.

Gold prices print mild gains of 0.16% on a day while testing $1,882 during the pre-European session trading. In doing so, the yellow metal portrays an inverse head and shoulders bullish chart pattern on the hourly (1H) formation.

With the MACD flashing bullish signals, even if mild, odds of the quote’s upside break to the pattern’s neckline, at $1,887.60 now, become brighter.

However, a confluence of 200-HMA and a falling trend line from October 21 can challenge gold buyers around $1,892 afterward. During the metal’s sustained run-up past-$1,892, the $1,900 threshold holds the key to further upside.

Alternatively, $1,873 and the previous month’s low near $1,860 can act as immediate supports ahead of highlighting the September’s low near $1,848.

While buyers are likely to return around the September bottom, any more weakness below the same might allow challenging the early-July tops near $1,818.

Gold hourly chart

Trend: Further recovery expected

Additional important levels

Overview
Today last price1882.02
Today Daily Change3.04
Today Daily Change %0.16%
Today daily open1878.98
 
Trends
Daily SMA201900.09
Daily SMA501915.66
Daily SMA1001889.63
Daily SMA2001770.07
 
Levels
Previous Daily High1889.86
Previous Daily Low1864.44
Previous Weekly High1911.46
Previous Weekly Low1860
Previous Monthly High1933.3
Previous Monthly Low1860
Daily Fibonacci 38.2%1880.15
Daily Fibonacci 61.8%1874.15
Daily Pivot Point S11865.66
Daily Pivot Point S21852.34
Daily Pivot Point S31840.24
Daily Pivot Point R11891.08
Daily Pivot Point R21903.18
Daily Pivot Point R31916.5

Author

Anil Panchal

Anil Panchal

FXStreet

Anil Panchal has nearly 15 years of experience in tracking financial markets. With a keen interest in macroeconomics, Anil aptly tracks global news/updates and stays well-informed about the global financial moves and their implications.

More from Anil Panchal
Share:

Editor's Picks

EUR/USD rebounds from session lows, stays below 1.1650

EUR/USD is recovers modestly from session lows but remains in the red below 1.1650 in European trading on Thursday. The pair faces headwinds from a renewed uptick in the US Dollar amid a negative shift in risk sentiment. Surging energy prices due to the Middle East war keep the bearish pressure intact on the Euro. The US Jobless Claims data are next of note. 

GBP/USD stays weak near 1.3350 amid UK stagflation risks

GBP/USD sticks to losses near 1.3350 in the European session on Thursday. The Pound Sterling loses ground amid fears that the United Kingdom economy could face stagflation risks due to higher energy prices, while the US Dollar attracts fresh havem demand ahead of the US Jobless Claims data. 

Gold climbs near $5,200 as Iran war fuels safe-haven demand

Gold price extends its gains for the second successive session on Thursday as traders seek safety amid the ongoing war in the Middle East. US and Israeli strikes across Iranian territory and widespread Iranian missile and drone retaliation across the Middle East, including attacks on regional targets and military sites, prolong the crisis and its impact.

Three reasons to be bearish on Bitcoin

Bitcoin is holding up well taking into account the uncertainty stemming from the Middle East. Despite this week’s rally, the long-term outlook remains bearish. Here are three reasons why I think the storm for the largest cryptocurrency isn't over yet.

Markets attempt to rally on positive news from Iran

There’s been an abrupt change in sentiment this morning, European stock markets are higher and oil and gas prices are moderating, after comments from Iran’s deputy minister about pre-conflict talks between Iran and the US.

Cardano Price Analysis: Approaches key trendline amid bearish sentiment

Cardano (ADA) price is approaching its descending trendline around $0.28 at the time of writing, set to shape the next directional move. The derivatives metrics paint a bearish picture, with ADA’s Open Interest continuing to fall and short bets rising among traders.