|

Gold Price Analysis: XAU/USD struggles for direction, flat-lined above $1,780 level

  • Gold struggled to capitalize on the overnight bounce from the vicinity of the $1,765-60 support.
  • The recent pullback and the lack of any follow-through buying warrants caution for bullish traders.

Gold reversed an intraday dip to the $1,774 area and is currently placed near the top end of its daily trading range, around the $1,782-83 region.

Worries that surging COVID-19 infections in some countries could derail the global economic recovery continued lending some support to the safe-haven XAU/USD. Apart from this, the emergence of some fresh selling around the US dollar further benefitted the dollar-denominated commodity. However, a modest pickup in the US Treasury bond yields kept a lid on any further gains for the non-yielding yellow metal.

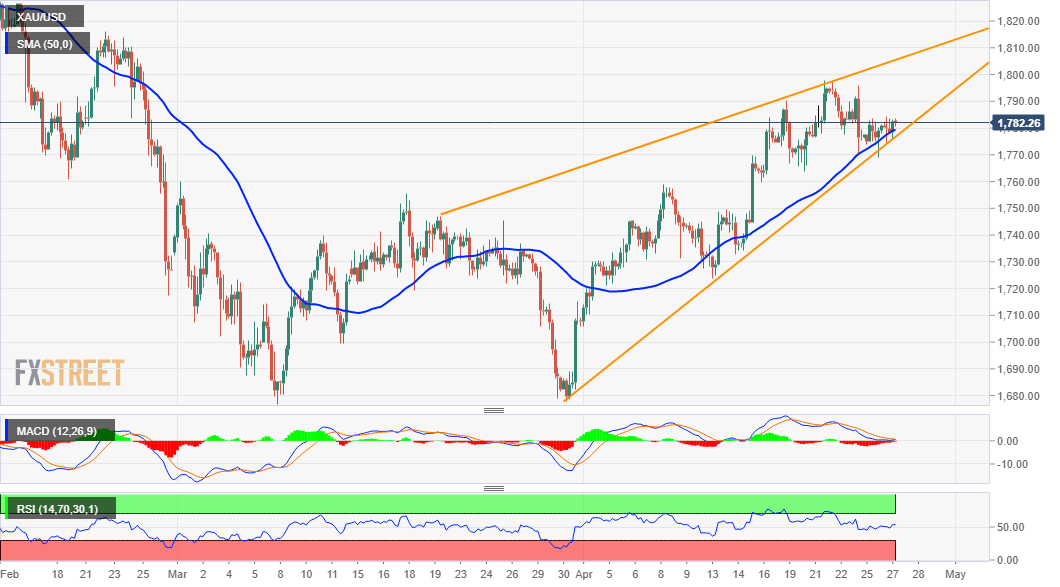
From a technical perspective, the XAU/USD stalled its recent pullback from the vicinity of the $1,800 mark, or two-month tops and found decent support ahead of the $1,765-60 region. The mentioned area marked the neckline resistance breakpoint of a bullish double-bottom formation near the $1,677-76 region. The emergence of some dip-buying near the mentioned resistance-turned-support favours bullish traders.

Meanwhile, technical indicators on hourly/daily charts are holding in the bullish territory and add credence to the constructive set-up. That said, the lack of any strong follow-through buying warrants some caution. Moreover, the recent price action between two converging trend-line now seemed to constitute the formation of a rising wedge, suggesting that the corrective bounce might have run out of steam.

This, in turn, suggests that investors have now moved on the sidelines and await fresh catalyst from the latest FOMC monetary policy decision, due on Wednesday. Hence, it will be prudent to wait for a sustained move beyond the $1,800 mark before positioning for any further appreciating move. Conversely, a convincing break below the $1,765-60 resistance-turned-support might shift the bias back in favour of bearish traders.

XAU/USD 4-hour chart

fxsoriginal

Technical levels to watch

XAU/USD

Overview
Today last price1782.6
Today Daily Change1.44
Today Daily Change %0.08
Today daily open1781.16
 
Trends
Daily SMA201749.1
Daily SMA501746.55
Daily SMA1001802.9
Daily SMA2001856.94
 
Levels
Previous Daily High1783.54
Previous Daily Low1768.81
Previous Weekly High1797.93
Previous Weekly Low1763.7
Previous Monthly High1759.98
Previous Monthly Low1676.87
Daily Fibonacci 38.2%1777.91
Daily Fibonacci 61.8%1774.44
Daily Pivot Point S11772.13
Daily Pivot Point S21763.11
Daily Pivot Point S31757.4
Daily Pivot Point R11786.86
Daily Pivot Point R21792.57
Daily Pivot Point R31801.59

Author

Haresh Menghani

Haresh Menghani is a detail-oriented professional with 10+ years of extensive experience in analysing the global financial markets.

More from Haresh Menghani
Share:

Markets move fast. We move first.

Orange Juice Newsletter brings you expert driven insights - not headlines. Every day on your inbox.

By subscribing you agree to our Terms and conditions.

Editor's Picks

EUR/USD clings to small gains near 1.1750

Following a short-lasting correction in the early European session, EUR/USD regains its traction and clings to moderate gains at around 1.1750 on Monday. Nevertheless, the pair's volatility remains low, with investors awaiting this weeks key data releases from the US and the ECB policy announcements.

GBP/USD edges higher toward 1.3400 ahead of US data and BoE

GBP/USD reverses its direction and advances toward 1.3400 following a drop to the 1.3350 area earlier in the day. The US Dollar struggles to gather recovery momentum as markets await Tuesday's Nonfarm Payrolls data, while the Pound Sterling holds steady ahead of the BoE policy announcements later in the week.

Gold pulls away from session high, holds above $4,300

Gold loses its bullish momentum and retreats below $4,350 after testing this level earlier on Monday. XAU/USD, however, stays in positive territory as the US Dollar remains on the back foot on growing expectations for a dovish Fed policy outlook next year.

Solana consolidates as spot ETF inflows near $1 billion signal institutional dip-buying

Solana price hovers above $131 at the time of writing on Monday, nearing the upper boundary of a falling wedge pattern, awaiting a decisive breakout. On the institutional side, demand for spot Solana Exchange-Traded Funds remained firm, pushing total assets under management to nearly $1 billion since launch. 

Big week ends with big doubts

The S&P 500 continued to push higher yesterday as the US 2-year yield wavered around the 3.50% mark following a Federal Reserve (Fed) rate cut earlier this week that was ultimately perceived as not that hawkish after all. The cut is especially boosting the non-tech pockets of the market.

Solana Price Forecast: SOL consolidates as spot ETF inflows near $1 billion signal institutional dip-buying

Solana (SOL) price hovers above $131 at the time of writing on Monday, nearing the upper boundary of a falling wedge pattern, awaiting a decisive breakout.