Gold (XAU/USD) is attempting a tepid bounce after falling 1% on Thursday amid a sharp recovery staged by the US dollar. Risk-aversion gripped the markets on Bloomberg report that the Biden administration is proposing higher taxes on the wealthy to pay for its social plan. Flight to safety lifted the safe-haven greenback at the expense of stocks and gold. However, the losses in the yellow metal were limited by the sell-off in Treasury yields as well.
The focus now remains on the dynamics in the yields and the dollar for fresh trading impetus. In the meantime, let's take a look at how gold is positioned on the technical charts?
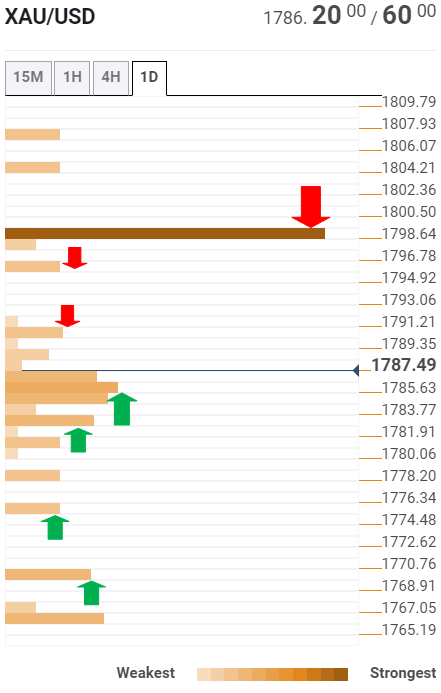
Gold Price Chart: Key resistance and support levels
The Technical Confluences Detector shows that gold looks to recapture the Fibonacci 61.8% resistance at $1791.
A break above which would clear the path towards $1796, the pivot point one-day R1.
Further up, the XAU buyers need to find acceptance above $1800 to take on the further upside. That level is the confluence zone of the previous day high, pivot point one-week R and pivot point one-month R2.
Alternatively, gold is likely to find solid demand around $1786, where a cluster of minor support levels lies, which comprises of the previous high four-hour and Fibonacci 38.2% one-day.
The next support is seen at the previous week high of $1784, below which the convergence of the Fibonacci 23.6% one-day and SMA5 one-day at $1781 could get tested.
The Fibonacci 23.6% one-week at $1771 could be challenged if the previous day low of $1777 gives way.
Here is how it looks on the tool
About Technical Confluences Detector
The TCD (Technical Confluences Detector) is a tool to locate and point out those price levels where there is a congestion of indicators, moving averages, Fibonacci levels, Pivot Points, etc. Knowing where these congestion points are located is very useful for the trader, and can be used as a basis for different strategies.
Information on these pages contains forward-looking statements that involve risks and uncertainties. Markets and instruments profiled on this page are for informational purposes only and should not in any way come across as a recommendation to buy or sell in these assets. You should do your own thorough research before making any investment decisions. FXStreet does not in any way guarantee that this information is free from mistakes, errors, or material misstatements. It also does not guarantee that this information is of a timely nature. Investing in Open Markets involves a great deal of risk, including the loss of all or a portion of your investment, as well as emotional distress. All risks, losses and costs associated with investing, including total loss of principal, are your responsibility. The views and opinions expressed in this article are those of the authors and do not necessarily reflect the official policy or position of FXStreet nor its advertisers. The author will not be held responsible for information that is found at the end of links posted on this page.
If not otherwise explicitly mentioned in the body of the article, at the time of writing, the author has no position in any stock mentioned in this article and no business relationship with any company mentioned. The author has not received compensation for writing this article, other than from FXStreet.
FXStreet and the author do not provide personalized recommendations. The author makes no representations as to the accuracy, completeness, or suitability of this information. FXStreet and the author will not be liable for any errors, omissions or any losses, injuries or damages arising from this information and its display or use. Errors and omissions excepted.
The author and FXStreet are not registered investment advisors and nothing in this article is intended to be investment advice.


Recommended content
Editors’ Picks

AUD/USD: Next on the upside comes the 2025 peak
AUD/USD maintained its constructive outlook well and sound, advancing for the fourth day in a row and surpassing the key barrier at 0.6300 the figure with certain conviction.

EUR/USD: Further gains retarget 1.1470
EUR/USD alternated gains with losses around the 1.1350-1.1360 band in a context of further weakness in the US Dollar and a generalised improved mood in the risk-associated assets.

Gold trades with marked losses near $3,200
Gold seems to have met some daily contention around the $3,200 zone on Monday, coming under renewed downside pressure after hitting record highs near $3,250 earlier in the day, always amid alleviated trade concerns. Declining US yields, in the meantime, should keep the downside contained somehow.

Solana ETF to debut in Canada after approval from regulators
Solana ETF will go live in Canada this week after the Ontario Securities Commission greenlighted applications from Purpose, Evolve, CI and 3iQ. The products will allow staking, enabling investors to earn yield on their holdings.

Is a recession looming?
Wall Street skyrockets after Trump announces tariff delay. But gains remain limited as Trade War with China continues. Recession odds have eased, but investors remain fearful. The worst may not be over, deeper market wounds still possible.

The Best brokers to trade EUR/USD
SPONSORED Discover the top brokers for trading EUR/USD in 2025. Our list features brokers with competitive spreads, fast execution, and powerful platforms. Whether you're a beginner or an expert, find the right partner to navigate the dynamic Forex market.