Gold (XAU/USD) is extending its corrective decline from seven-week highs of $1790 reached on Monday. The rebound in the US Treasury yields serves as a key driver for the pullback in the non-yielding gold, which offsets the impact of the sagging dollar. US President Joe Biden’s efforts to seek a deal on his $2.25 trillion infrastructure proposal revived the buying interest around the yields. The global covid vaccine optimism also collaborated with the uptick in the US rates.
How is the metal positioned on the technical charts?
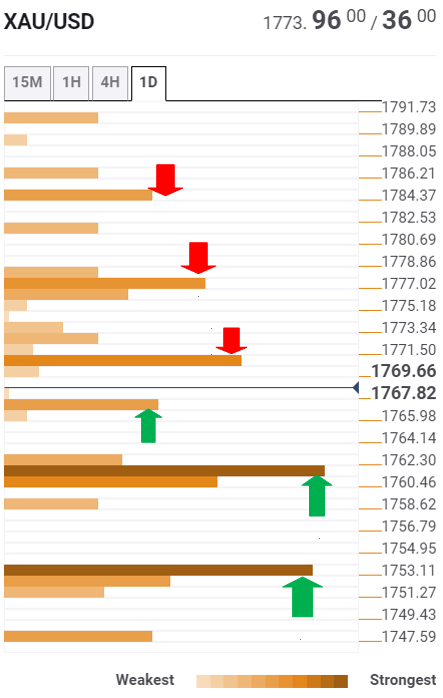
Gold Price Chart: Key resistance and support levels
The Technical Confluences Detector shows that gold’s pullback is testing minor support around $1766, which is the convergence of the previous day low and Bollinger Band four-hour middle.
Defending the $1761 cushion is critical for the XAU bulls. At that point, the SMA100 one-hour coincides with the Fibonacci 38.2% one-week and the previous month high.
The next powerful cap is seen at $1754, the confluence of the pivot point one-month R1 and pivot point one-day S2.
On the flip side, recapturing the $1771 hurdle (Fibonacci 23.6% one-week) could bring the $1777 resistance back in the play. The latter is the intersection of the Fibonacci 38.2% one-day and SMA10 four-hour.
Further up, the previous week high of $1784 could challenge the bullish traders, as they look to retest the multi-week tops clinched a day before.
Here is how it looks on the tool
About Technical Confluences Detector
The TCD (Technical Confluences Detector) is a tool to locate and point out those price levels where there is a congestion of indicators, moving averages, Fibonacci levels, Pivot Points, etc. Knowing where these congestion points are located is very useful for the trader, and can be used as a basis for different strategies.
Information on these pages contains forward-looking statements that involve risks and uncertainties. Markets and instruments profiled on this page are for informational purposes only and should not in any way come across as a recommendation to buy or sell in these assets. You should do your own thorough research before making any investment decisions. FXStreet does not in any way guarantee that this information is free from mistakes, errors, or material misstatements. It also does not guarantee that this information is of a timely nature. Investing in Open Markets involves a great deal of risk, including the loss of all or a portion of your investment, as well as emotional distress. All risks, losses and costs associated with investing, including total loss of principal, are your responsibility. The views and opinions expressed in this article are those of the authors and do not necessarily reflect the official policy or position of FXStreet nor its advertisers. The author will not be held responsible for information that is found at the end of links posted on this page.
If not otherwise explicitly mentioned in the body of the article, at the time of writing, the author has no position in any stock mentioned in this article and no business relationship with any company mentioned. The author has not received compensation for writing this article, other than from FXStreet.
FXStreet and the author do not provide personalized recommendations. The author makes no representations as to the accuracy, completeness, or suitability of this information. FXStreet and the author will not be liable for any errors, omissions or any losses, injuries or damages arising from this information and its display or use. Errors and omissions excepted.
The author and FXStreet are not registered investment advisors and nothing in this article is intended to be investment advice.


Recommended content
Editors’ Picks

Gold hovers around all-time highs near $3,250
Gold is holding steady near the $3,250 mark, fuelled by robust safe-haven demand, trade war concerns, and a softer-than-expected US inflation gauge. The US Dollar keeps trading with heavy losses around three-year lows.

EUR/USD retreats towards 1.1300 as Wall Street shrugs off trade war headlines
The EUR/USD pair retreated further from its recent multi-month peak at 1.1473 and trades around the 1.1300 mark. Wall Street manages to advance ahead of the weekly close, despite escalating tensions between Washington and Beijing and mounting fears of a US recession. Profit-taking ahead of the close also weighs on the pair.

GBP/USD trims gains, recedes to the 1.3050 zone
GBP/USD now gives away part of the earlier advance to fresh highs near 1.3150. Meanwhile, the US Dollar remains offered amid escalating China-US trade tensions, recession fears in the US, and softer-than-expected US Producer Price data.

Bitcoin, Ethereum, Dogecoin and Cardano stabilze – Why crypto is in limbo
Bitcoin, Ethereum, Dogecoin and Cardano stabilize on Friday as crypto market capitalization steadies around $2.69 trillion. Crypto traders are recovering from the swing in token prices and the Monday bloodbath.

Is a recession looming?
Wall Street skyrockets after Trump announces tariff delay. But gains remain limited as Trade War with China continues. Recession odds have eased, but investors remain fearful. The worst may not be over, deeper market wounds still possible.

The Best brokers to trade EUR/USD
SPONSORED Discover the top brokers for trading EUR/USD in 2025. Our list features brokers with competitive spreads, fast execution, and powerful platforms. Whether you're a beginner or an expert, find the right partner to navigate the dynamic Forex market.