- Gold struggled to capitalize on its early move up, instead witnessed a turnaround from one-week tops
- A fresh leg up in the US bond yields, the risk-on mood both contributed to the intraday selling bias.
- Mixed oscillators warrant caution for aggressive traders ahead of the Advance US Q1 GDP report.
Gold continued losing ground through the mid-European session and dropped to fresh daily lows, around the $1,772 region in the last hour.
The precious metal struggled to capitalize on its early positive move, instead witnessed an intraday turnaround from one-week tops. The underlying bullish tone was seen as a key factor that acted as a headwind for the safe-haven XAU/USD. This, along with a strong pickup in the US Treasury bond yields, prompted some fresh selling around the non-yielding yellow metal.
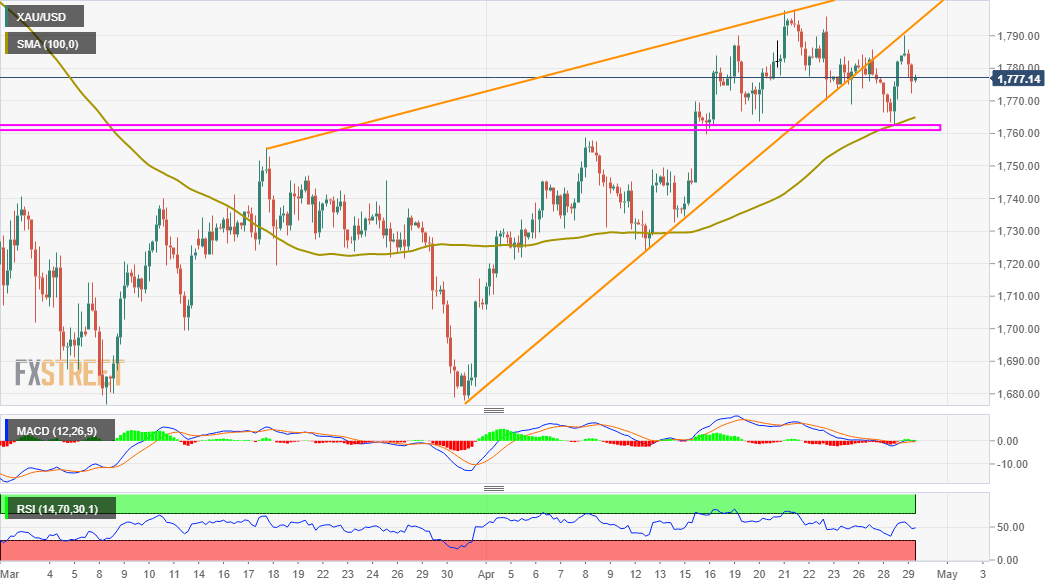
Looking at the technical picture, the overnight goodish rebound from the $1,765-60 strong resistance breakpoint, now turned support, stalled near the $1,790 region. This comes on the back of the recent failures near the $1,800 mark and suggests that the recent strong recovery from multi-month lows, around the $1,677-76 region might have already run out of steam.
The bearish outlook is reinforced by the fact that the XAU/USD on Wednesday confirmed a break below a bearish rising wedge pattern. Moreover, technical indicators on hourly charts have been drifting lower in the bearish territory. That said, oscillators on the daily chart are still holding in the negative zone and warrants some caution for aggressive bearish traders.
This makes it prudent to wait for sustained weakness below the mentioned resistance-turned-support before positioning for any further depreciating move. The XAU/USD might then accelerate the fall towards intermediate support near the $1,745 horizontal level en-route the $1,723-22 region. Bears might eventually aim to challenge the $1,700 round-figure mark.
On the flip side, the daily swing highs, around the $1,790 area now seems to act as an immediate hurdle. This is closely followed by near two-month tops, around the $1,797-98 region touched last week. A subsequent move beyond will shift the bias back in favour of bullish traders and push the XAU/USD to the next relevant resistance, around the $1,818 area.
XAU/USD 4-hour chart
Technical levels to watch
Information on these pages contains forward-looking statements that involve risks and uncertainties. Markets and instruments profiled on this page are for informational purposes only and should not in any way come across as a recommendation to buy or sell in these assets. You should do your own thorough research before making any investment decisions. FXStreet does not in any way guarantee that this information is free from mistakes, errors, or material misstatements. It also does not guarantee that this information is of a timely nature. Investing in Open Markets involves a great deal of risk, including the loss of all or a portion of your investment, as well as emotional distress. All risks, losses and costs associated with investing, including total loss of principal, are your responsibility. The views and opinions expressed in this article are those of the authors and do not necessarily reflect the official policy or position of FXStreet nor its advertisers. The author will not be held responsible for information that is found at the end of links posted on this page.
If not otherwise explicitly mentioned in the body of the article, at the time of writing, the author has no position in any stock mentioned in this article and no business relationship with any company mentioned. The author has not received compensation for writing this article, other than from FXStreet.
FXStreet and the author do not provide personalized recommendations. The author makes no representations as to the accuracy, completeness, or suitability of this information. FXStreet and the author will not be liable for any errors, omissions or any losses, injuries or damages arising from this information and its display or use. Errors and omissions excepted.
The author and FXStreet are not registered investment advisors and nothing in this article is intended to be investment advice.
Recommended content
Editors’ Picks

EUR/USD stays defensive near 1.0550 amid a cautious start to the week
EUR/USD stays defensive near 1.0550 in Monday’s European session. The pair remains undermined by the re-emergence of the Russia-Ukraine geopolitical risks even though the US Dollar stalls its uptrend. Divergent ECB-Fed policy outlooks also weigh on the pair ahead of central banks' talks.

GBP/USD defends 1.2600 on subdued US Dollar
GBP/USD defends minor bids above 1.2600 in the early European session on Monday. A broadly subdued US Dollar and less dovish BoE policy outlook support the pair amid cautious market mood, induced by resurfacing Russia-Ukraine conflict. BoE- and Fed-speak eyed.

Gold price faces rejection near $2,600; bulls remain on the sidelines despite softer USD
Gold price (XAU/USD) struggles to capitalize on its modest intraday gains to the $2,600 neighborhood, though it manages to hold in positive territory through the early part of the European session on Monday.

Top 3 Price Prediction Bitcoin, Ethereum, Ripple: BTC consolidates after a new all-time high
Bitcoin (BTC) price remains in a consolidation phase after reaching a new all-time high of $93,265 last week. Ethereum's (ETH) price is nearing its support level; a close below would cause a further price decline, while Ripple's (XRP) price shows bullish momentum as it tests and potentially breaks key resistance.

Week ahead: Preliminary November PMIs to catch the market’s attention
With the dust from the US elections slowly settling down, the week is about to reach its end and we have a look at what next week’s calendar has in store for the markets. On the monetary front, a number of policymakers from various central banks are scheduled to speak.

Best Forex Brokers with Low Spreads
VERIFIED Low spreads are crucial for reducing trading costs. Explore top Forex brokers offering competitive spreads and high leverage. Compare options for EUR/USD, GBP/USD, USD/JPY, and Gold.