- Sustained USD selling, COVID-19 jitters assisted gold to regain positive traction on Friday.
- The recent breakout through the double-bottom neckline resistance favours bullish traders.
- A move beyond the $1,800 mark, en-route $1,815-16 resistance, looks a distinct possibility.
Gold managed to regain positive traction on the last trading day of the week and reversed a part of the previous day's rejection slide from the $1,800 neighbourhood. The commodity maintained its bid tone through the mid-European session and was last seen hovering around the $1,790 region, up 0.40% for the day.
The emergence of some fresh selling around the US dollar was seen as one of the key factors that continued lending some support to the dollar-denominated commodity. Apart from this, concerns about soaring COVID-19 cases in some countries further benefitted the safe-haven XAU/USD and remained supportive.
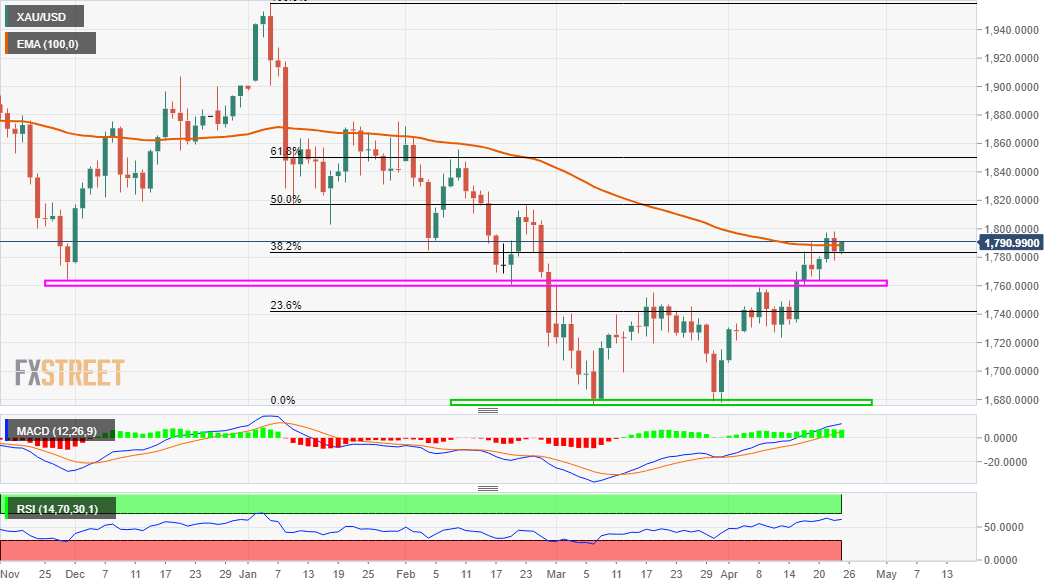
Looking at the technical picture, last week's strong move beyond the $1,760-65 resistance zone validated a double-bottom bullish breakout and supports prospects for additional near-term gains. The constructive set-up is reinforced by bullish technical indicators, which are still far from being in the overbought territory.
Hence, a subsequent strength beyond the $1,800 mark, towards the $1,815-16 resistance, remains a distinct possibility. The latter coincides with the 50% Fibonacci level of the $1,959-$1,676 downfall, which if cleared will set the stage for an extension of the recent appreciating move witnessed since the beginning of this month.
On the flip side, the double-bottom neckline resistance breakpoint, around the $1,765-60 region now seems to act as immediate strong support. This is followed by the 23.6% Fibo. level, around the $1,745-44 area and the $1,730 level. Sustained weakness below will negate the positive outlook and prompt some technical selling.
The XAU/USD might then turn vulnerable and accelerate the fall towards challenging the $1,700 round-figure mark. Some follow-through selling would expose the double-bottom support, around the $1,677-76 region, or multi-month lows touched in March.
XAU/USD daily chart
Technical levels to watch
Information on these pages contains forward-looking statements that involve risks and uncertainties. Markets and instruments profiled on this page are for informational purposes only and should not in any way come across as a recommendation to buy or sell in these assets. You should do your own thorough research before making any investment decisions. FXStreet does not in any way guarantee that this information is free from mistakes, errors, or material misstatements. It also does not guarantee that this information is of a timely nature. Investing in Open Markets involves a great deal of risk, including the loss of all or a portion of your investment, as well as emotional distress. All risks, losses and costs associated with investing, including total loss of principal, are your responsibility. The views and opinions expressed in this article are those of the authors and do not necessarily reflect the official policy or position of FXStreet nor its advertisers. The author will not be held responsible for information that is found at the end of links posted on this page.
If not otherwise explicitly mentioned in the body of the article, at the time of writing, the author has no position in any stock mentioned in this article and no business relationship with any company mentioned. The author has not received compensation for writing this article, other than from FXStreet.
FXStreet and the author do not provide personalized recommendations. The author makes no representations as to the accuracy, completeness, or suitability of this information. FXStreet and the author will not be liable for any errors, omissions or any losses, injuries or damages arising from this information and its display or use. Errors and omissions excepted.
The author and FXStreet are not registered investment advisors and nothing in this article is intended to be investment advice.
Recommended content
Editors’ Picks

EUR/USD stays below 1.0400 ahead of US inflation data
EUR/USD struggles to stage a rebound on Friday and continues to trade below 1.0400 following Wednesday's sharp decline that was caused by the Federal Reserve's hawkish tone. Investors await November PCE inflation data from the US.

GBP/USD touches fresh multi-month low below 1.2500
GBP/USD recovers to the 1.2500 area after touching its lowest level since May near 1.2470. The pair stays on the back foot after the Fed and the BoE policy announcements this week pointed to a potentially diverging policy outlook.

Gold price holds steady around $2,600; upside potential seems limited
Gold price attracts some haven flows amid the looming risk of a US government shutdown and trades near $2,600. The global flight to safety-led pullback in the US bond yields further benefits the XAU/USD. The Fed’s hawkish stance acts as a tailwind for the USD and should cap any further upside.

Bitcoin, Ethereum and Ripple crash, wiping $1.17 billion from the market
Bitcoin price trades below $98,000 on Friday after declining more than 6% this week. Ethereum and Ripple followed BTC’s footsteps, closing below their key support and declining 12% and 4.5%, respectively, this week.

Bank of England stays on hold, but a dovish front is building
Bank of England rates were maintained at 4.75% today, in line with expectations. However, the 6-3 vote split sent a moderately dovish signal to markets, prompting some dovish repricing and a weaker pound. We remain more dovish than market pricing for 2025.

Best Forex Brokers with Low Spreads
VERIFIED Low spreads are crucial for reducing trading costs. Explore top Forex brokers offering competitive spreads and high leverage. Compare options for EUR/USD, GBP/USD, USD/JPY, and Gold.
