Gold bears the burden of the global rush to equities while standing on the slippery ground near $1,857, down 0.75% intraday, ahead of Wednesday’s European session.
Although record-high coronavirus (COVID-19) cases and the death toll from the US joins Brexit worries and the US-China tussle to challenge the market sentiment, hopes that the American covid stimulus is on the way favor stocks. Also on the positive side could be expectations that the vaccine developments will soon tame the global pandemic.
Meanwhile, fears of the hard Brexit and the first contraction in the Chinese Consumer Price Index (CPI) since late-2009 fails to recall the bears.
While portraying the market mood, stocks in Asia-Pacific and the futures are also positive whereas the US 10-year Treasury yields rise 2.5 basis points to 0.93% by press time.
Read: Asian Stock Market: Chatters over vaccine, stimulus favor bulls to track Wall Street gains
Gold: Key levels to watch
Failures to cross the $1,870 upside barrier, comprising SMA 10 on one hour (1H), SMA 50 on 15M and Pivot Point one-week (W1) Resistance 1, portrays underlying weakness in gold prices.
However, SMA 5 on one day (1D) and SMA 100 on 1H together offer strong support around $1,850 to break for the gold sellers.
Should the bears manage to conquer the $1,850 support, Fibonacci 38.2% on one-month (1M), around $1,843, can return to the charts.
Meanwhile, Fibonacci 61.8% one-day, SMA 200 on four-hour (4H) and the middle band of Bollinger on the 1H and 15-minute play, around $1,866/67, can offer immediate resistance during the bullion’s fresh upside targeting $1,870 hurdle.
It should also be noted that the clear break above $1,870 can direct gold buyers toward the mid-November highs near the $1,900 threshold.
Here is how it looks on the tool
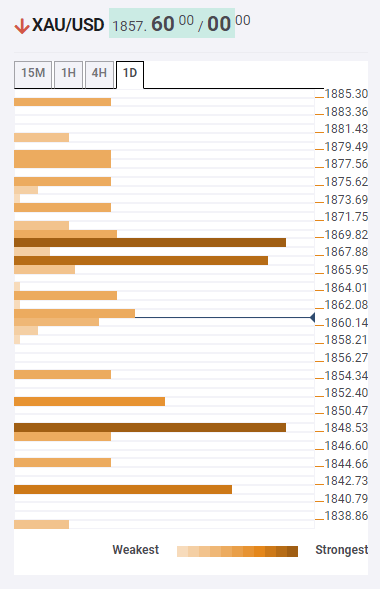
Confluence Detector
The Confluence Detector finds exciting opportunities using Technical Confluences. The TC is a tool to locate and point out those price levels where there is a congestion of indicators, moving averages, Fibonacci levels, Pivot Points, etc. Knowing where these congestion points are located is very useful for the trader, and can be used as a basis for different strategies.
Information on these pages contains forward-looking statements that involve risks and uncertainties. Markets and instruments profiled on this page are for informational purposes only and should not in any way come across as a recommendation to buy or sell in these assets. You should do your own thorough research before making any investment decisions. FXStreet does not in any way guarantee that this information is free from mistakes, errors, or material misstatements. It also does not guarantee that this information is of a timely nature. Investing in Open Markets involves a great deal of risk, including the loss of all or a portion of your investment, as well as emotional distress. All risks, losses and costs associated with investing, including total loss of principal, are your responsibility. The views and opinions expressed in this article are those of the authors and do not necessarily reflect the official policy or position of FXStreet nor its advertisers. The author will not be held responsible for information that is found at the end of links posted on this page.
If not otherwise explicitly mentioned in the body of the article, at the time of writing, the author has no position in any stock mentioned in this article and no business relationship with any company mentioned. The author has not received compensation for writing this article, other than from FXStreet.
FXStreet and the author do not provide personalized recommendations. The author makes no representations as to the accuracy, completeness, or suitability of this information. FXStreet and the author will not be liable for any errors, omissions or any losses, injuries or damages arising from this information and its display or use. Errors and omissions excepted.
The author and FXStreet are not registered investment advisors and nothing in this article is intended to be investment advice.
Recommended content
Editors’ Picks

Gold hovers around all-time highs near $3,250
Gold is holding steady near the $3,250 mark, fuelled by robust safe-haven demand, trade war concerns, and a softer-than-expected US inflation gauge. The US Dollar keeps trading with heavy losses around three-year lows.

EUR/USD retreats towards 1.1300 as Wall Street shrugs off trade war headlines
The EUR/USD pair retreated further from its recent multi-month peak at 1.1473 and trades around the 1.1300 mark. Wall Street manages to advance ahead of the weekly close, despite escalating tensions between Washington and Beijing and mounting fears of a US recession. Profit-taking ahead of the close also weighs on the pair.

GBP/USD trims gains, recedes to the 1.3050 zone
GBP/USD now gives away part of the earlier advance to fresh highs near 1.3150. Meanwhile, the US Dollar remains offered amid escalating China-US trade tensions, recession fears in the US, and softer-than-expected US Producer Price data.

Bitcoin, Ethereum, Dogecoin and Cardano stabilze – Why crypto is in limbo
Bitcoin, Ethereum, Dogecoin and Cardano stabilize on Friday as crypto market capitalization steadies around $2.69 trillion. Crypto traders are recovering from the swing in token prices and the Monday bloodbath.

Is a recession looming?
Wall Street skyrockets after Trump announces tariff delay. But gains remain limited as Trade War with China continues. Recession odds have eased, but investors remain fearful. The worst may not be over, deeper market wounds still possible.

The Best brokers to trade EUR/USD
SPONSORED Discover the top brokers for trading EUR/USD in 2025. Our list features brokers with competitive spreads, fast execution, and powerful platforms. Whether you're a beginner or an expert, find the right partner to navigate the dynamic Forex market.