Gold Price Analysis: XAU/USD slides below $1,885 level, erases Thursday’s modest gains
- Gold price rebounds on dovish Fed expectations despite hotter US inflation.
- Weakness in US dollar and Treasury yields motivate gold bulls.
- Gold Weekly Forecast: XAU/USD snaps four-week winning streak, closes below $1,900.

Update: Gold continued with its struggle to find acceptance or build on the momentum beyond the $1,900 mark and witnessed some fresh selling on the last trading day of the week. The US dollar made a solid comeback and moved back closer to weekly tops. This, in turn, was seen as a key factor that exerted some downward pressure on the dollar-denominated commodity. Apart from this, an extended rally in the global equity markets further acted as a headwind for traditional safe-haven assets, including gold.
The commodity dropped to fresh session lows, below the $1,885 level in the last hour and has now erased the previous day's post-US CPI gains. However, a combination of factors might help limit any deeper losses. Investors shrugged off signs of increasing inflationary pressure and seem convinced that the Fed will retain its ultra-lose monetary policy stance for a longer period. This, along with a further decline in the US Treasury bond yields, might lend some support to the non-yielding gold.
Nevertheless, gold remains on track to end with modest losses for the second consecutive week as the market focus now shifts to the upcoming FOMC policy meeting on June 15-16. The outcome will play a key role in influencing the near-term USD price dynamics and assist investors to determine the next leg of a directional move for the XAU/USD.
Previous update: Gold price has retraced below the $1900 mark once again, having tested Tuesday’s high near $1903. The latest leg down in gold price comes on the back of a tepid bounce staged by the US dollar, as the Treasury yields trim losses across the curve. The greenback fell in tandem with the US rates on Thursday after strong US CPI data failed to ignite investors’ beliefs that the Fed could begin dialing back stimulus, as they continued to see the price rise as temporary.
Meanwhile, a dovish stance by the ECB and optimism on the US infrastructure spending plan also collaborated with the upside in the gold price. Next of relevance for gold price remains the G7 talks and the US Michigan Preliminary Consumer Sentiment data for fresh moves.
Gold price is looking to extend Thursday’s stellar performance on the final trading day of this week, as the bulls briefly recapture the $1900 mark. The ongoing decline in the US Treasury yields continues to boost gold price at the dollar’s expense. Despite a hotter-than-expected US CPI print, markets remain hopeful that the Fed will dismiss the price rise as temporary and maintain its accommodative monetary policy stance until its employment goals are achieved. Therefore, the greenback tumbled alongside the yields, bumping up the gold price from five-day lows near $1870.
The narrative around the dovish Fed expectation will continue to play out heading into the FOMC decision due next week, underpinning the sentiment around gold. In the meantime, traders await the Michigan Preliminary Consumer Sentiment data for some near-term trading incentives.
Read: Top commodities to trade amid global reflation: Silver and copper to outshine gold price
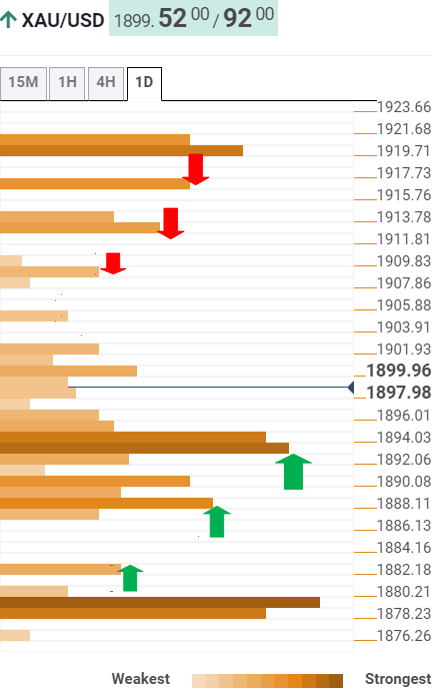
Gold Price: Key levels to watch
The Technical Confluences Detector shows that gold price is looking to retest the previous month high at $1913 on the bullish reversal.
Ahead of that target, the pivot point one-day R1 at $1908 needs to be cleared.
If the buying interest accelerates, gold price could revisit the previous week high at $1917.
Meanwhile, the bulls remain hopeful so long as the price holds above powerful support around $1894, which is the confluence of the SMA5 four-hour, Fibonacci 61.8% one-week and Fibonacci 23.6% one-day.
The next line of defense awaits around $1890, where the Fibonacci 38.2% one-day coincides with the SMA10 four-hour.
Further south, the Fibonacci 61.8% one-day at $1882 could come to the buyers’ rescue.
Here is how it looks on the tool
About Technical Confluences Detector
The TCD (Technical Confluences Detector) is a tool to locate and point out those price levels where there is a congestion of indicators, moving averages, Fibonacci levels, Pivot Points, etc. If you are a short-term trader, you will find entry points for counter-trend strategies and hunt a few points at a time. If you are a medium-to-long-term trader, this tool will allow you to know in advance the price levels where a medium-to-long-term trend may stop and rest, where to unwind positions, or where to increase your position size.
Author

Dhwani Mehta
FXStreet
Residing in Mumbai (India), Dhwani is a Senior Analyst and Manager of the Asian session at FXStreet. She has over 10 years of experience in analyzing and covering the global financial markets, with specialization in Forex and commodities markets.


