Gold (XAU/USD) started out the US Non-Farm Payrolls (NFP) week on a solid footing, rallying nearly $20 on Monday. The metal bounced-off the SMA100 one-day support for the third straight day, courtesy of the broad retreat in the US dollar from two-month peaks.
The risk-on mood returned amid upbeat Chinese Industrial Profits data, lifting the sentiment on the global markets at the expense of the safe-haven greenback. Further, hopes of the US Congress reaching a fiscal stimulus deal also added to the broader market optimism.
Attention now turns towards a slew of speeches by the Fed policymakers, US Consumer Confidence data and the first US Presidential election debate for fresh cues on the prices. Meanwhile, let’s see how gold is positioned technically.
Gold: Key resistances and supports
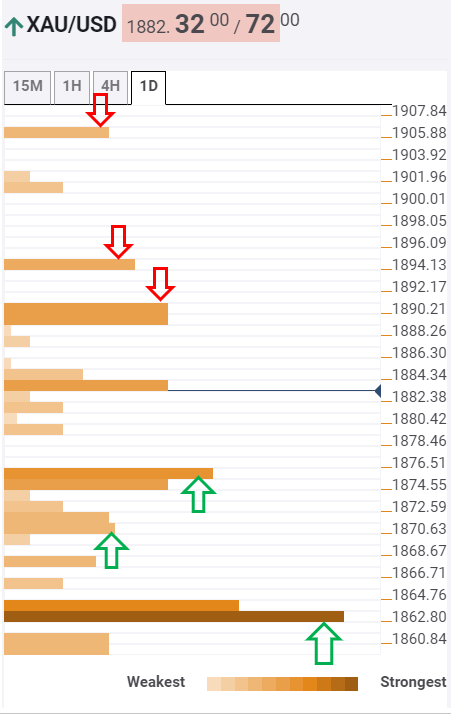
Following the corrective move higher, the Technical Confluences Indicator suggests that Gold faces immediate fierce resistance at $1889, which is the convergence of the Fibonacci 38.2% one-week and Bollinger Band 15-minutes Upper.
Buyers will then look to takeout the next hurdle at $1894, the intersection of the pivot point one-day R1 and Bollinger Band one-hour Upper.
A sharp rally towards the $1905 barrier will get fuelled, which is the pivot point one-day R2.
To the downside, significant support at $1875 could likely limit the pullbacks. At that level, the SMA5 one-day coincides with the Fibonacci 23.6% one-day.
Further down, a bunch of minor support levels will slow the declines before the bullion reaches the critical cushion at $1863, which is the convergence of the previous month low, Fibonacci 61.8% one-day and pivot point one-month S1.
Here is how it looks on the tool
About Confluence Detector
The TCI (Technical Confluences Indicator) is a tool to locate and point out those price levels where there is a congestion of indicators, moving averages, Fibonacci levels, Pivot Points, etc. Knowing where these congestion points are located is very useful for the trader, and can be used as a basis for different strategies.
Learn more about Technical Confluence
Information on these pages contains forward-looking statements that involve risks and uncertainties. Markets and instruments profiled on this page are for informational purposes only and should not in any way come across as a recommendation to buy or sell in these assets. You should do your own thorough research before making any investment decisions. FXStreet does not in any way guarantee that this information is free from mistakes, errors, or material misstatements. It also does not guarantee that this information is of a timely nature. Investing in Open Markets involves a great deal of risk, including the loss of all or a portion of your investment, as well as emotional distress. All risks, losses and costs associated with investing, including total loss of principal, are your responsibility. The views and opinions expressed in this article are those of the authors and do not necessarily reflect the official policy or position of FXStreet nor its advertisers. The author will not be held responsible for information that is found at the end of links posted on this page.
If not otherwise explicitly mentioned in the body of the article, at the time of writing, the author has no position in any stock mentioned in this article and no business relationship with any company mentioned. The author has not received compensation for writing this article, other than from FXStreet.
FXStreet and the author do not provide personalized recommendations. The author makes no representations as to the accuracy, completeness, or suitability of this information. FXStreet and the author will not be liable for any errors, omissions or any losses, injuries or damages arising from this information and its display or use. Errors and omissions excepted.
The author and FXStreet are not registered investment advisors and nothing in this article is intended to be investment advice.


Recommended content
Editors’ Picks

EUR/USD bounces off lows, retests 1.1370
Following an early drop to the vicinity of 1.1310, EUR/USD now manages to regain pace and retargets the 1.1370-1.1380 band on the back of a tepid knee-jerk in the US Dollar, always amid growing optimism over a potential de-escalation in the US-China trade war.

GBP/USD trades slightly on the defensive in the low-1.3300s
GBP/USD remains under a mild selling pressure just above 1.3300 on Friday, despite firmer-than-expected UK Retail Sales. The pair is weighed down by a renewed buying interest in the Greenback, bolstered by fresh headlines suggesting a softening in the rhetoric surrounding the US-China trade conflict.

Gold remains offered below $3,300
Gold reversed Thursday’s rebound and slipped toward the $3,260 area per troy ounce at the end of the week in response to further improvement in the market sentiment, which was in turn underpinned by hopes of positive developments around the US-China trade crisis.

Ethereum: Accumulation addresses grab 1.11 million ETH as bullish momentum rises
Ethereum saw a 1% decline on Friday as sellers dominated exchange activity in the past 24 hours. Despite the recent selling, increased inflows into accumulation addresses and declining net taker volume show a gradual return of bullish momentum.

Week ahead: US GDP, inflation and jobs in focus amid tariff mess – BoJ meets
Barrage of US data to shed light on US economy as tariff war heats up. GDP, PCE inflation and nonfarm payrolls reports to headline the week. Bank of Japan to hold rates but may downgrade growth outlook. Eurozone and Australian CPI also on the agenda, Canadians go to the polls.

The Best brokers to trade EUR/USD
SPONSORED Discover the top brokers for trading EUR/USD in 2025. Our list features brokers with competitive spreads, fast execution, and powerful platforms. Whether you're a beginner or an expert, find the right partner to navigate the dynamic Forex market.