|

Gold Price Analysis: XAU/USD eyes 200-day SMA

  • Gold looks south, having breached support at $1,850. 
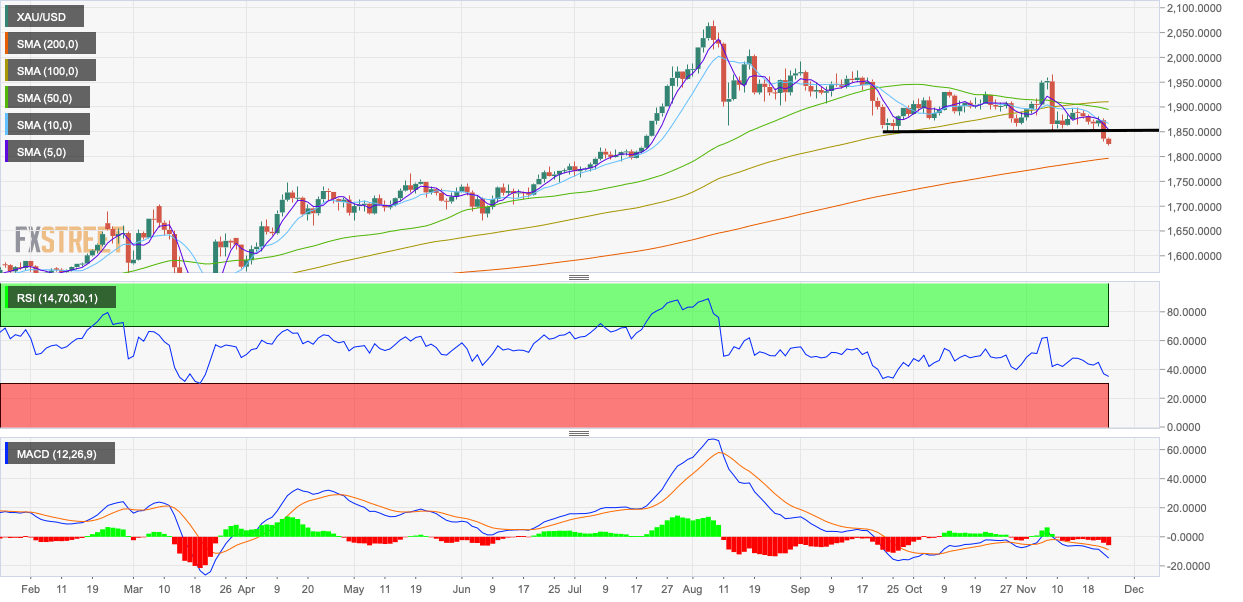
  • The daily chart indicators favor a deeper drop to the 200-day SMA. 

Having found acceptance under long-held support, gold now risks falling to the 200-day Simple Moving Average (SMA). 

The yellow metal closed below $1,850 on Monday, violating the level, which acted as a strong floor multiple times since September. 

The breakdown is backed by a below-50 or bearish reading on the 14-day Relative Strength Index (RSI) and a negative MACD histogram. The 5- and 10-day SMAs are trending south, indicating a bearish setup, and so is the bearish crossover of the 50- and 100-day SMAs. 

As such, the long-term SMA of $1,796 could soon come into play. The yellow metal is currently trading at a four-month low of $1,824 per ounce, representing a 0.68% drop on the day. 

Daily chart

Trend: Bearish

Technical levels

XAU/USD

Overview
Today last price1824
Today Daily Change-13.58
Today Daily Change %-0.68
Today daily open1836.12
 
Trends
Daily SMA201886.06
Daily SMA501897.46
Daily SMA1001910.27
Daily SMA2001795.22
 
Levels
Previous Daily High1876.14
Previous Daily Low1831.01
Previous Weekly High1899.14
Previous Weekly Low1852.8
Previous Monthly High1933.3
Previous Monthly Low1860
Daily Fibonacci 38.2%1848.25
Daily Fibonacci 61.8%1858.9
Daily Pivot Point S11819.37
Daily Pivot Point S21802.63
Daily Pivot Point S31774.24
Daily Pivot Point R11864.5
Daily Pivot Point R21892.89
Daily Pivot Point R31909.63

Author

Omkar Godbole

Omkar Godbole

FXStreet Contributor

Omkar Godbole, editor and analyst, joined FXStreet after four years as a research analyst at several Indian brokerage companies.

More from Omkar Godbole
Share:

Markets move fast. We move first.

Orange Juice Newsletter brings you expert driven insights - not headlines. Every day on your inbox.

By subscribing you agree to our Terms and conditions.

Editor's Picks

EUR/USD ticks lower following the release of FOMC Minutes

The US Dollar found some near-term demand following the release of the FOMC meeting minutes, with the EUR/USD pair currently piercing the 1.1750 threshold. The document showed officials are still willing to trim interest rates. Meanwhile, thinned holiday trading keeps major pairs confined to familiar levels.

GBP/USD remains sub- 1.3500, remains in the red

The GBP/USD lost traction early in the American session, maintaining the sour tone and trading around 1.3460 following the release of the FOMC meeting minutes. Trading conditions remain thin ahead of the New Year holiday, limiting the pair's volatility.

Gold stable above $4,350 as the year comes to an end

Gold price got to recover some modest ground on Tuesday, holding on to intraday gains and changing hands at $4,360 a troy ounce in the American afternoon. The bright metal showed no reaction to the release of the FOMC December meeting minutes.

Ethereum: ETH holds above $2,900 despite rising selling activity

Ethereum (ETH) held the $2,900 level despite seeing increased selling pressure over the past week. The Exchange Netflow metric showed deposits outweighed withdrawals by about 400K ETH. The high value suggests rising selling activity amid the holiday season.

Economic outlook 2026-2027 in advanced countries: Solidity test

After a year marked by global economic resilience and ending on a note of optimism, 2026 looks promising and could be a year of solid economic performance. In our baseline scenario, we expect most of the supportive factors at work in 2025 to continue to play a role in 2026.

Crypto market outlook for 2026

Year 2025 was volatile, as crypto often is.  Among positive catalysts were favourable regulatory changes in the U.S., rise of Digital Asset Treasuries (DAT), adoption of AI and tokenization of Real-World-Assets (RWA).