|

Gold Price Analysis: XAU/USD eyes $1,820 as next target – Confluence Detector

Falling yields have always been good for gold – and this time, the precious metal seems to have found its feet regardless of the Treausiries. Tuesday's slide in returns on 10-year bonds sent XAU/USD shooting higher, and it stayed there also after yields crept up once again.

One of the explanations for the recent rise is the hint from the Fed that the pace of bond-buying will be reduced only gradually – 15 billion fewer dollars worth of buys every month rather than $20 billion.

How is XAU/USD technically positioned? 

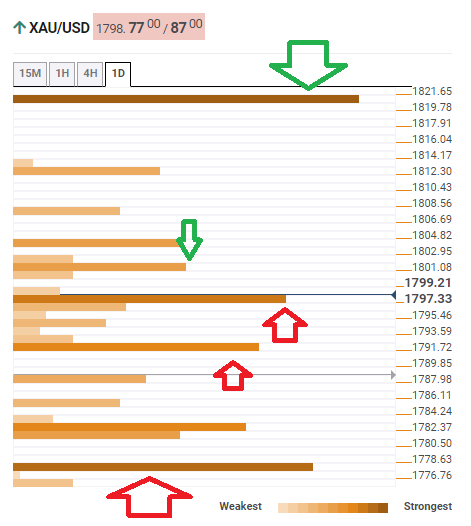
The Technical Confluences Detector is showing that gold faces some resistance at $1,802, which is the convergence of the 100-day Simple Moving Average, the Bollinger Band 15min-Upper, and the previous 4h-high. 

The more significant line is $1,820, which is where the Pivot Point one-month Resistance 1 and the PP one-day R2 meet up.

Immediate support awaits at $1,797, which is the confluence of the 200-day SMA and the PP one-week Resistance 2. 

The next line to watch is $1,791, which is a juncture of indicators including the Fibonacci 61.8% one-month and the SMA 100-15m. 

Lower, strong support awaits at $1,777, which is where the PP one-week, the 50-day SMA, and the SMA 50-1h all converge. 

XAU/USD resistance and support levels

Confluence Detector

The Confluence Detector finds exciting opportunities using Technical Confluences. The TC is a tool to locate and point out those price levels where there is a congestion of indicators, moving averages, Fibonacci levels, Pivot Points, etc. Knowing where these congestion points are located is very useful for the trader, and can be used as a basis for different strategies.

Learn more about Technical Confluence

Author

Yohay Elam

Yohay Elam

FXStreet

Yohay is in Forex since 2008 when he founded Forex Crunch, a blog crafted in his free time that turned into a fully-fledged currency website later sold to Finixio.

More from Yohay Elam
Share:

Editor's Picks

EUR/USD holds above 1.1750 after mixed PMI data

EUR/USD manages to hold above 1.1750 but struggles to gather recovery momentum on Friday, following the mixed February PMI figures from Germany and the Eurozone. In the second half of the day, Q4 GDP, December inflation and February PMI data from the US will be watched closely by market participants.

GBP/USD recovers above 1.3450 after strong UK Retail Sales data

GBP/USD is recovering ground above 1.3450 in European trading on Friday, helped by a modest uptick in the Pound Sterling after a bigger-than-expected increase in the UK Retail Sales for January. However, the further upside appears limited in the pair amid persistent US Dollar strength and ahead of key UK and US data. 

Gold rises for third day on geopolitical risks, US data eyed

Gold gains some positive traction for the third consecutive day on Friday. The upside potential, however, seems limited amid the mixed fundamental backdrop. Moreover, traders might opt to wait for the key US macro releases – the Advance Q4 GDP report and the Personal Consumption Expenditures (PCE) Price Index – before placing fresh directional bets.

US GDP growth expected to slow down significantly in Q4 after stellar Q3 

The United States Bureau of Economic Analysis will publish the first preliminary estimate of the fourth-quarter Gross Domestic Product at 13:30 GMT. Analysts forecast the US economy to have expanded at a 3% annualized rate, slowing down from the 4.4% growth posted in the previous quarter.

Hawkish Fed minutes and a market finding its footing

It was green across the board for US Stock market indexes at the close on Wednesday, with most S&P 500 names ending higher, adding 38 points (0.6%) to 6,881 overall. At the GICS sector level, energy led gains, followed by technology and consumer discretionary, while utilities and real estate posted the largest losses.

Official Trump price approaches breakout with mixed signals from traders

Official Trump (TRUMP) is trading at $3.50 at the time of writing, approaching its upper consolidation range. A breakout from this range could open the door for an upside move. On-chain data shows market indecision, with balanced flows between bulls and bears, signaling a lack of clear directional bias.