- Gold prices recede from $1,813.40 after a three-day winning streak.
- Spinning top suggests traders’ indecision, can be clubbed with recent sluggish moves.
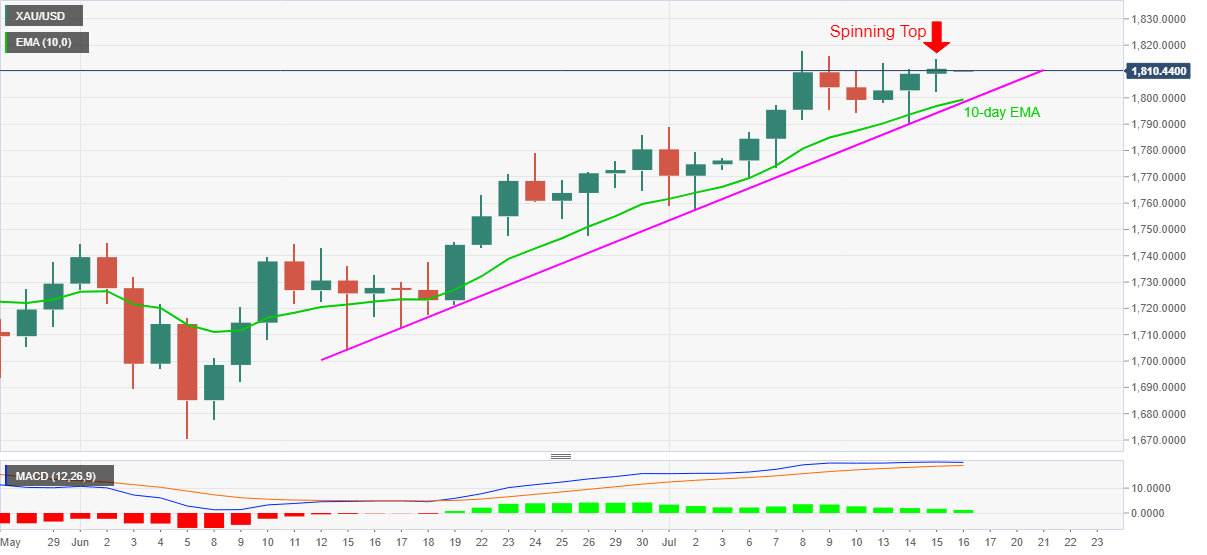
- Sustained trading beyond 10-day EMA, the monthly support line portrays bullion’s strength.
- The month-start top adds to the downside barrier, multiple resistances stand tall to guard further advances past-$1,800.
Gold prices ease from one week high to $1,810 amid early Thursday morning in Asia. The bullion marked consecutive third positive daily closing the previous day. However, sluggish moves portray a “Spinning Top” candlestick formation suggesting traders’ indecision. The pattern joins the quote’s recent failures to refresh monthly high in suggesting the underlying weakness of the bullish momentum.
As a result, the bears could seek fresh entries targeting $1,800-$1,798 support area comprising 10-day EMA and an upward sloping trend line from June 15. However, any further weakness by the yellow metal will divert the bears towards July 01 top near $1,789.
It should also be noted that the Gold price weakness past-$1,789 might not refrain from attacking the early-June peaks near $1,745.
On the contrary, the monthly top, also the multi-year high, around $1,818 acts as an immediate resistance, a break of which could escalate the bullion’s north-run towards August 30, 2011 peak surrounding $1,840.
Additionally, the precious metal’s ability to stay strong beyond $1,840 enables it to aim for the record high of $1,921 flashed during September 2011.
Gold daily chart
Trend: Pullback expected
Information on these pages contains forward-looking statements that involve risks and uncertainties. Markets and instruments profiled on this page are for informational purposes only and should not in any way come across as a recommendation to buy or sell in these assets. You should do your own thorough research before making any investment decisions. FXStreet does not in any way guarantee that this information is free from mistakes, errors, or material misstatements. It also does not guarantee that this information is of a timely nature. Investing in Open Markets involves a great deal of risk, including the loss of all or a portion of your investment, as well as emotional distress. All risks, losses and costs associated with investing, including total loss of principal, are your responsibility. The views and opinions expressed in this article are those of the authors and do not necessarily reflect the official policy or position of FXStreet nor its advertisers. The author will not be held responsible for information that is found at the end of links posted on this page.
If not otherwise explicitly mentioned in the body of the article, at the time of writing, the author has no position in any stock mentioned in this article and no business relationship with any company mentioned. The author has not received compensation for writing this article, other than from FXStreet.
FXStreet and the author do not provide personalized recommendations. The author makes no representations as to the accuracy, completeness, or suitability of this information. FXStreet and the author will not be liable for any errors, omissions or any losses, injuries or damages arising from this information and its display or use. Errors and omissions excepted.
The author and FXStreet are not registered investment advisors and nothing in this article is intended to be investment advice.


Recommended content
Editors’ Picks

EUR/USD remains depressed near 1.1350
The US Dollar now grabs momentum and motivates EUR/USD to return to the 1.1350 zone on Thursday, as investors continue to digest the ECB’s decision to lower its policy rates by 25 basis points, as widely estimated. It is worth noting that most markets will be closed on April 18, Good Friday.

GBP/USD maintains the consolidation around 1.3260
The upside momentum in the British pound remains well and sound on Thursday, underpinning the eighth consecutive daily advance in GBP/USD, which now trades in a consolidative fashion near 1.326. Cable’s strong performance comes despite the marked rebound in the US Dollar.

Gold bounces off daily lows, back near $3,320
The prevailing risk-on mood among traders challenges the metal’s recent gains and prompts a modest knee-jerk in its prices on Thursday. After bottoming out near the $3,280 zone per troy ounce, Gold prices are now reclaiming the $3,320 area in spite of the stronger Greenback.

Crypto market cap fell more than 18% in Q1, wiping out $633.5 billion after Trump’s inauguration top
CoinGecko’s Q1 Crypto Industry Report highlights that the total crypto market capitalization fell by 18.6% in the first quarter, wiping out $633.5 billion after topping on January 18, just a couple of days ahead of US President Donald Trump’s inauguration.

Future-proofing portfolios: A playbook for tariff and recession risks
It does seem like we will be talking tariffs for a while. And if tariffs stay — in some shape or form — even after negotiations, we’ll likely be talking about recession too. Higher input costs, persistent inflation, and tighter monetary policy are already weighing on global growth.

The Best brokers to trade EUR/USD
SPONSORED Discover the top brokers for trading EUR/USD in 2025. Our list features brokers with competitive spreads, fast execution, and powerful platforms. Whether you're a beginner or an expert, find the right partner to navigate the dynamic Forex market.