Gold Price Analysis: XAU/USD bulls eye $1,850 after surging above $1,800 – Confluence Detector
- Gold has broken above the $1,800 mark, hitting the highest levels since February.
- The Confluence Detector is showing that XAU/USD has very few barriers through $1,850.
- Gold Price Forecast: XAU/USD to post additional gains with daily close above $1,800

It has finally happened – Gold has staged a convincing break above the $1,800, hitting a high of $1,813.63 at the time of writing. Falling US Treasury yields have prompted investors to buy gold, and cascading stop-losses have also been attributed to the upswing in the price of the precious metal.
How is gold positioned on the technical charts? Examining clusters of support and resistance lines can help provide answers.
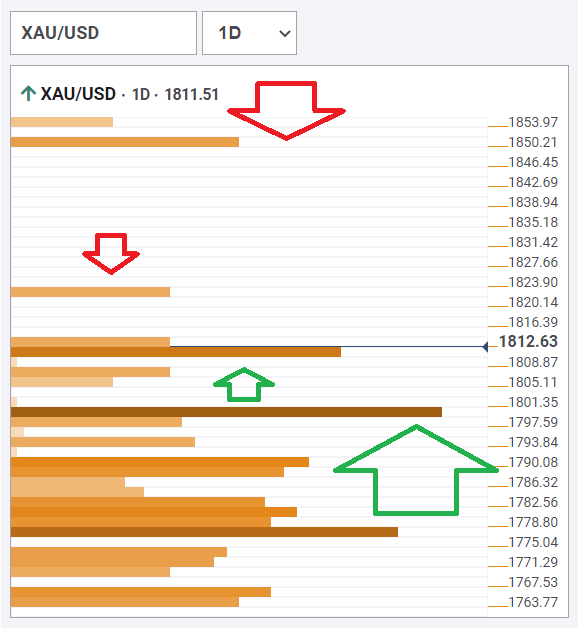
The Technical Confluences Detector is pointing to showing that the next resistance line is at around $1,822, which is where the Pivot Point one-week Resistance 3 hits the gold price chart.
The next substantial hurdle for XAU/USD awaits at $1,850, which is the convergence of the 200-day Simple Moving Average and the Pivot Point one-month Resistance 2.
Initial support is at around $1,810, which is where the PP one-month R1, the PP one-day R3 and the Fibonacci 161.8% one-week all meet up on the gold price chart.
A more significant cushion is at $1,799, which is a juncture including the previous monthly high, the 100-day SMA, and the PP one-day R2.
XAU/USD resistance and support levels
Confluence Detector
The Confluence Detector finds exciting opportunities using Technical Confluences. The TC is a tool to locate and point out those price levels where there is a congestion of indicators, moving averages, Fibonacci levels, Pivot Points, etc. Knowing where these congestion points are located is very useful for the trader, and can be used as a basis for different strategies.
Author

Yohay Elam
FXStreet
Yohay is in Forex since 2008 when he founded Forex Crunch, a blog crafted in his free time that turned into a fully-fledged currency website later sold to Finixio.


