Gold Price Analysis: USD bears sink their teeth, gold breaks resistance
- Gold is back into the hands of the bulls as price breaks resistance.
- Bulls may seek to reengage on the 4-hour chart to target $1,856/59.

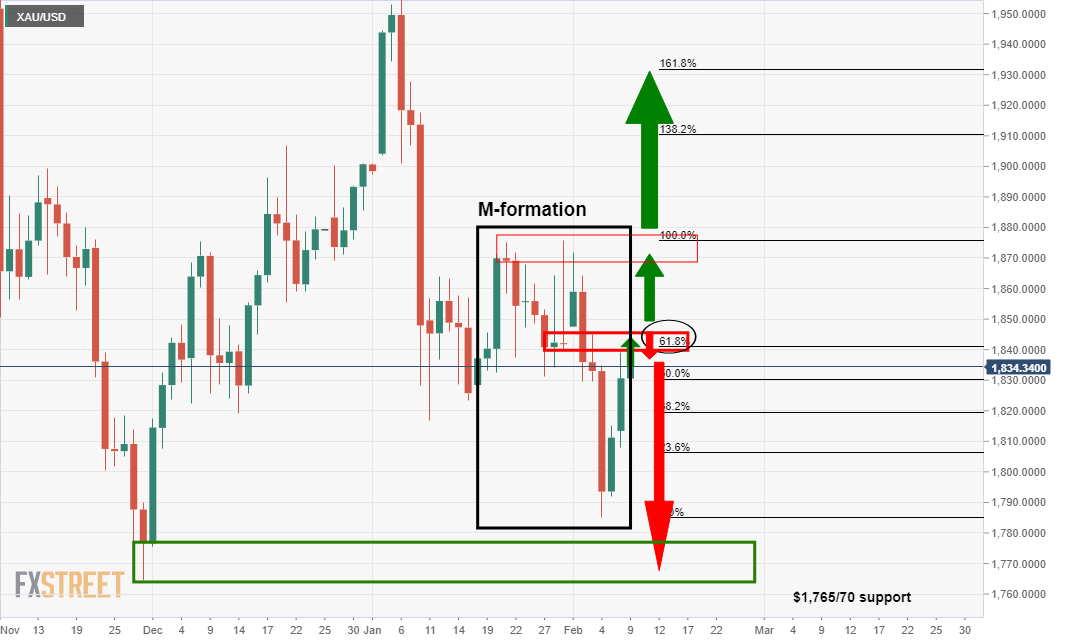
Further to the start of the week's analysis, Gold Price Analysis: Bears to target a run to weekly support at $1,765, a critical resistance has been broken, denying the bears an easy lunch.
Instead, the price of gold is back into the hand's of the bulls and their next move is what matters most from a technical standpoint. More on that below.
Meanwhile, from a fundamental standpoint, the market is in two minds as to the fate of the US dollar, switching from hot to cold.
The DXY is trading down to a one-week low as a drop in US Treasury yields raised doubts about the outlook for the greenback when considering the fiscal stimulus package that the Democrats are proposing.
President Joe Biden's $1.9 trillion COVID-19 relief package is massive and combined with ultra-easy Federal Reserve monetary policy, there is a strong argument that this will ultimately prove to be a dollar headwind.
The US current account deficit and the uncertainties surrounding the ability of the economy to rebound convincingly are all playing into the mix as investors weigh-up the outlook.
''Notwithstanding, the yellow metal continues to be treated as a safe-haven asset as the weak Nonfarm Payrolls print and the collapse in European PMIs were ultimately the forces that helped to build a margin of safety against deeper selling pressure,'' analysts at TD Securities argued.
The eurozone composite PMI fell from 49.1 in December to 47.5 in January.
The data raises a lot of concern from investors, with lockdowns being extended further into the first quarter, the risk is that sectors bearing the brunt of the lockdown face a significant, longer-lasting impact, such as bankruptcy.
Meanwhile, global inflation expectations are rising nonetheless, but if yields are proving that they may not be able to keep up. Therefore, the US dollar is going to be vulnerable which will benefit gold prices.
''The prospect of short end yield support for the USD, necessary to underpin a sustained lift, is unlikely to develop,'' analysts at Westpac explained, adding:
''The stability in real yields arguably has its origins in the Fed’s commitment to run a high-pressure economy to achieve inflation moderately above 2% inflation for some time. That implies short-end yield support for the USD is unlikely to emerge until much later in the recovery process. Absent a full complement of growth and yield support sustained DXY upside is likely to prove fleeting.''
Gold technical analysis
In the prior analysis, a resistance zone on the daily chart was identified as follows:
The area, in further inspection, is a strong confluence zone:
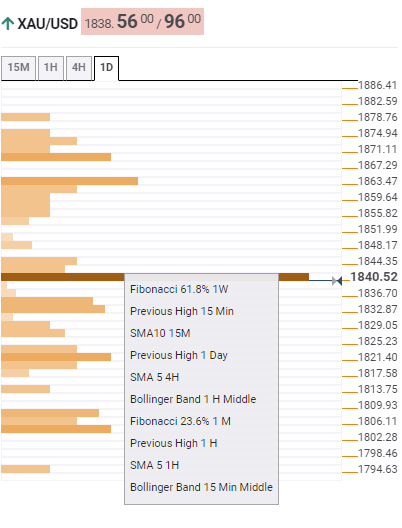
What is the Technical Confluence Detector?
The FXS Technical Confluence Detector is an in-house tool, developed by FXStreet experts, that allows you to identify those price levels where congestion of indicators like moving averages, Fibonacci levels, Pivot Points occurs. Knowing where these congestion points are located is very helpful as it allows the trader to see these areas of support and resistance easily.
This tool is customizable so you can choose the asset selectors and the time frame that is more suitable for your trading operations.
4-hour support, gold
Meanwhile, the price has broken the resistance according to the 4-hour chart and bulls are holding off the bears on a re-test of the structure:
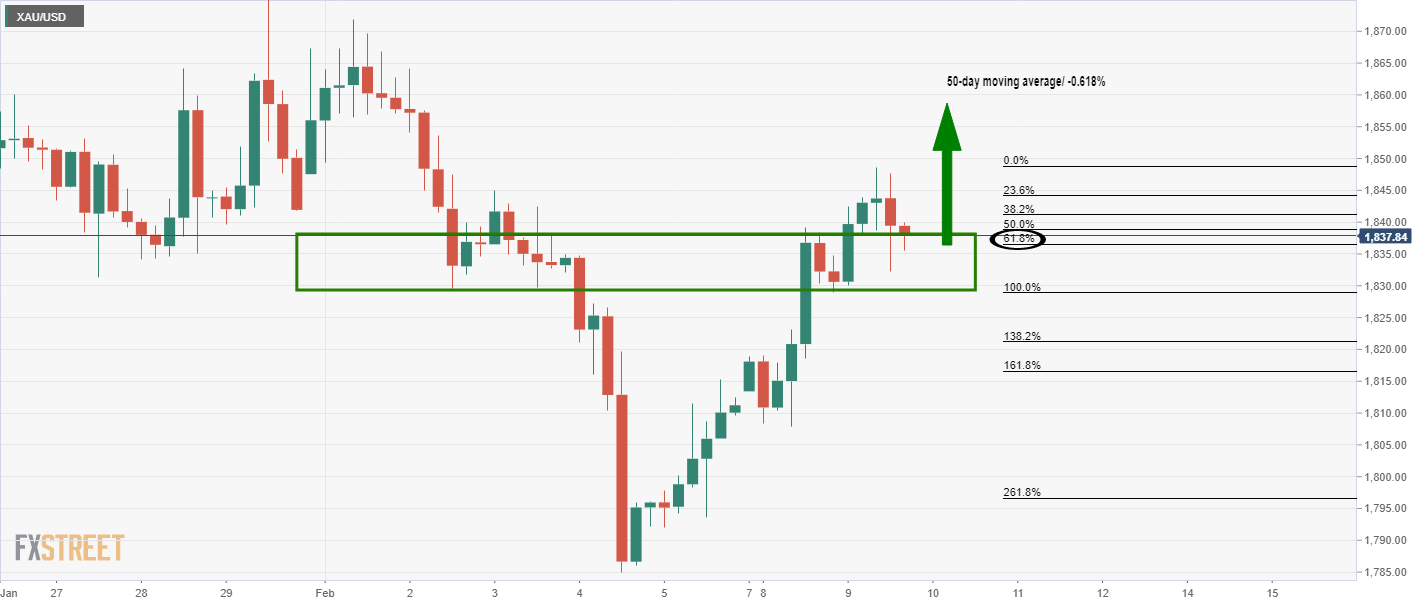
On this restest of the structure, demand would be expected to see the price rise to a confluence of the 50-day exponential moving average and a -0.618% Fibonacci retracement of the 4-hour correction's range, $1,856/59.
Author

Ross J Burland
FXStreet
Ross J Burland, born in England, UK, is a sportsman at heart. He played Rugby and Judo for his county, Kent and the South East of England Rugby team.