Gold (XAU/USD) looks to extend its recent bullish momentum starting out a fresh week amid hopes of additional fiscal stimulus under US President-elect Joe Biden. Biden is a presumptive victor, as the legal challenges by the Trump campaign remain.
Markets also cheer the prospects of continuity of the current policy environment even on a divided government, with Republicans taking hold of the Senate. The upbeat market mood continues to dimmish the US dollar’s attractiveness as a safe-haven. However, the gains in the global stocks and rising coronavirus cases could likely limit the upside in the metal. Let’s see how gold is positioned on the charts.
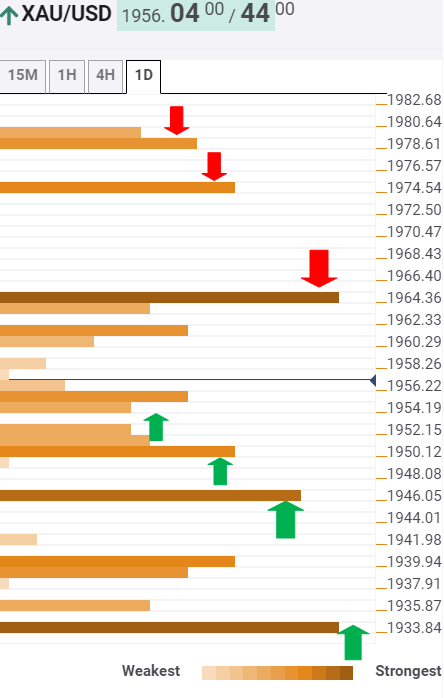
Gold: Key resistances and supports
The Technical Confluences Indicator shows that the yellow metal remains on track to test the critical resistance at $1965, which is the pivot point one-month R2.
Ahead of that level, the confluence of the previous day high and Bollinger Band one-hour Upper at $1961 could challenge the bulls’ commitment.
Should the XAU bulls recapture the $1965 hurdle, the next upside target is seen at $1975, which is the intersection of the pivot point one-day S2 and Bollinger Band four-hour Upper.
Further up, $1980 is the level to beat for the bulls. That level is the Fibonacci 161.8% one-month.
Alternatively, a stack of healthy support levels is found $1953-51 levels, which could continue to guard the downside.
Acceptance below the SMA10 four-hour at $1950 is needed to fuel a corrective decline towards $1947, the convergence of the Fibonacci 61.8% one-day and Bollinger Band one-day Upper.
The next downside target is aligned at $1940, where the Fibonacci 23.6% one-week awaits.
The $1934 strong support, the previous month high, will be a tough nut to crack for the sellers.
Here is how it looks on the tool
About Confluence Detector
The Confluence Detector finds exciting opportunities using Technical Confluences. The TC is a tool to locate and point out those price levels where there is a congestion of indicators, moving averages, Fibonacci levels, Pivot Points, etc. Knowing where these congestion points are located is very useful for the trader, and can be used as a basis for different strategies.
Learn more about Technical Confluence
Information on these pages contains forward-looking statements that involve risks and uncertainties. Markets and instruments profiled on this page are for informational purposes only and should not in any way come across as a recommendation to buy or sell in these assets. You should do your own thorough research before making any investment decisions. FXStreet does not in any way guarantee that this information is free from mistakes, errors, or material misstatements. It also does not guarantee that this information is of a timely nature. Investing in Open Markets involves a great deal of risk, including the loss of all or a portion of your investment, as well as emotional distress. All risks, losses and costs associated with investing, including total loss of principal, are your responsibility. The views and opinions expressed in this article are those of the authors and do not necessarily reflect the official policy or position of FXStreet nor its advertisers. The author will not be held responsible for information that is found at the end of links posted on this page.
If not otherwise explicitly mentioned in the body of the article, at the time of writing, the author has no position in any stock mentioned in this article and no business relationship with any company mentioned. The author has not received compensation for writing this article, other than from FXStreet.
FXStreet and the author do not provide personalized recommendations. The author makes no representations as to the accuracy, completeness, or suitability of this information. FXStreet and the author will not be liable for any errors, omissions or any losses, injuries or damages arising from this information and its display or use. Errors and omissions excepted.
The author and FXStreet are not registered investment advisors and nothing in this article is intended to be investment advice.


Recommended content
Editors’ Picks

Gold jumps to new record-high above $3,220 as China ramps up tariffs on US goods
Gold extends its relentless rally and trades at a new all-time high above $3,220 in the European session on Friday. The precious metal benefits from safe-haven flows following China's decision to raise additional tariffs on US imports to 125% from 84%.

EUR/USD climbs to fresh multi-year high above 1.1400 on intense USD weakness
EUR/USD continues to push higher and trades at its strongest level since February 2022 above 1.1400 in the European session on Friday. The US Dollar (USD) stays under heavy pressure after China raised tariffs on US imports in retaliation, fuelling the pair's upsurge.

GBP/USD extends the advance to near 1.3100 as USD selloff picks up steam
GBP/USD preserves its bullish momentum and advances to near 1.3100 in the European session. The persistent USD weakness remains the main market theme as fears over the deepening China-US trade conflict triggering a recession in the US continue to grow.

Bitcoin, Ethereum and Ripple show weakness while XRP stabilizes
Bitcoin and Ethereum prices are hovering around $80,000 and $1,500 on Friday after facing rejection from their respective key levels, indicating signs of weakness. Meanwhile, Ripple broke and found support around its critical level; maintenance suggests a recovery on the cards.

Trump’s tariff pause sparks rally – What comes next?
Markets staged a dramatic reversal Wednesday, led by a 12% surge in the Nasdaq and strong gains across major indices, following President Trump’s unexpected decision to pause tariff escalation for non-retaliating trade partners.

The Best brokers to trade EUR/USD
SPONSORED Discover the top brokers for trading EUR/USD in 2025. Our list features brokers with competitive spreads, fast execution, and powerful platforms. Whether you're a beginner or an expert, find the right partner to navigate the dynamic Forex market.