- Spot Gold prices are seeing further downside on Friday as investors pivot on Fed remarks.
- Fed looking more hawkish than market participants believed last week.
- US Dollar, US Treasury yields seeing gains for the week, Gold swoons.
XAU/USD prices are testing towards the downside on Friday, edging towards $1,930 after yesterday's hawkish comments from Federal Reserve (Fed) Chairman Jerome Powell, who suggested that the Fed may not have achieved suitably restrictive monetary policy to contain inflation.
Alongside Fed head Powell, several Fed policymakers hit newswires this week suggesting that rates may not be high enough to sufficiently cap inflation towards the Fed's 2% target looking forward. The hawkish stance completely eviscerated the broad-market narrative that the Fed was not only done with rate hikes, but would be heading into a rate-cut cycle soon.
Investors last week heralded the end of the Fed's rate hike cycle following a worse-than-expected US Nonfarm Payrolls (NFP) print last Friday, but Fed officials have spent the week warning that a single bad labor data reading is not enough to shift the dot plot.
Up Next: US CPI inflation data to balance Fed statements
Next week's US Consumer Price Index (CPI) inflation reading will carry extra weight on Tuesday as investors peel back the layers to see if inflation will cool enough for investors to resume hoping for future rate cuts to ease borrowing costs.
US CPI inflation figures are expected to soften month-on-month, with the headline October print forecast to decline from 0.4% to 0.1%, while the annualized Core CPI for the year into October is expected to hold steady at 4.1%.
A meet-or-beat print for annualized Core CPI would mean US inflation is still running over twice as hot as the Fed's target of 2% annually.
XAU/USD Technical Outlook
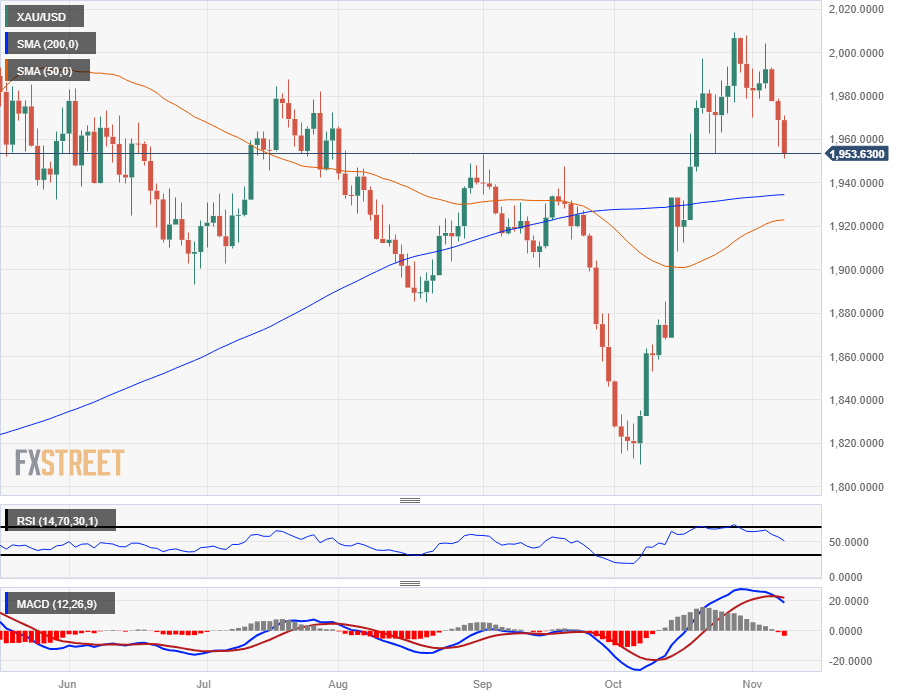
Spot Gold's declines on Friday accelerate price action into bear country, seeing a rejection from the 50-hour Simple Moving Average (SMA) from $1,965.
XAU/USD has closed entirely bearish for the week with little relief bidding, seeing a rejection from the 200-hour SMA early Monday and declining nearly 3% on the week.
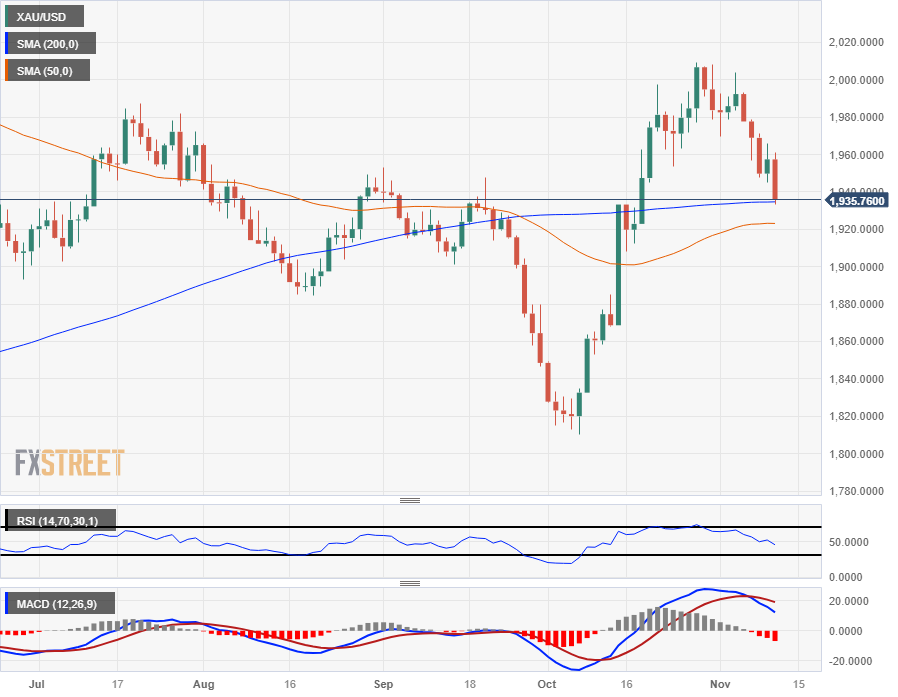
On the daily candlesticks, XAU/USD has slumped back into the 200-day SMA as Gold bids back into long-term median prices, and a constraining 50-day SMA on the bearish side of the longer moving average implies further downside could be on the cards.
XAU/USD Hourly Chart
XAU/USD Daily Chart
XAU/USD Technical Levels
Information on these pages contains forward-looking statements that involve risks and uncertainties. Markets and instruments profiled on this page are for informational purposes only and should not in any way come across as a recommendation to buy or sell in these assets. You should do your own thorough research before making any investment decisions. FXStreet does not in any way guarantee that this information is free from mistakes, errors, or material misstatements. It also does not guarantee that this information is of a timely nature. Investing in Open Markets involves a great deal of risk, including the loss of all or a portion of your investment, as well as emotional distress. All risks, losses and costs associated with investing, including total loss of principal, are your responsibility. The views and opinions expressed in this article are those of the authors and do not necessarily reflect the official policy or position of FXStreet nor its advertisers. The author will not be held responsible for information that is found at the end of links posted on this page.
If not otherwise explicitly mentioned in the body of the article, at the time of writing, the author has no position in any stock mentioned in this article and no business relationship with any company mentioned. The author has not received compensation for writing this article, other than from FXStreet.
FXStreet and the author do not provide personalized recommendations. The author makes no representations as to the accuracy, completeness, or suitability of this information. FXStreet and the author will not be liable for any errors, omissions or any losses, injuries or damages arising from this information and its display or use. Errors and omissions excepted.
The author and FXStreet are not registered investment advisors and nothing in this article is intended to be investment advice.


Recommended content
Editors’ Picks

EUR/USD bounces off lows, retests 1.1370
Following an early drop to the vicinity of 1.1310, EUR/USD now manages to regain pace and retargets the 1.1370-1.1380 band on the back of a tepid knee-jerk in the US Dollar, always amid growing optimism over a potential de-escalation in the US-China trade war.

GBP/USD trades slightly on the defensive in the low-1.3300s
GBP/USD remains under a mild selling pressure just above 1.3300 on Friday, despite firmer-than-expected UK Retail Sales. The pair is weighed down by a renewed buying interest in the Greenback, bolstered by fresh headlines suggesting a softening in the rhetoric surrounding the US-China trade conflict.

Gold remains offered below $3,300
Gold reversed Thursday’s rebound and slipped toward the $3,260 area per troy ounce at the end of the week in response to further improvement in the market sentiment, which was in turn underpinned by hopes of positive developments around the US-China trade crisis.

Ethereum: Accumulation addresses grab 1.11 million ETH as bullish momentum rises
Ethereum saw a 1% decline on Friday as sellers dominated exchange activity in the past 24 hours. Despite the recent selling, increased inflows into accumulation addresses and declining net taker volume show a gradual return of bullish momentum.

Week ahead: US GDP, inflation and jobs in focus amid tariff mess – BoJ meets
Barrage of US data to shed light on US economy as tariff war heats up. GDP, PCE inflation and nonfarm payrolls reports to headline the week. Bank of Japan to hold rates but may downgrade growth outlook. Eurozone and Australian CPI also on the agenda, Canadians go to the polls.

The Best brokers to trade EUR/USD
SPONSORED Discover the top brokers for trading EUR/USD in 2025. Our list features brokers with competitive spreads, fast execution, and powerful platforms. Whether you're a beginner or an expert, find the right partner to navigate the dynamic Forex market.