|

Gold Price Analysis: Bears finally catch a break

  • Gold bears take control and break into fresh bearish territory. 
  • Further downside on the cards, but market volatility is here to stay.

From an ongoing analysis, the bears have finally managed to catch the break that they were looking for and the prior analysis had forecasted originally, here:

and again, here:

Original forecast

End result

To be continued...

Next?

As illustrated, the trendline resistance held and the price eventually crumbled to the first target area. 

So where is next?

Casting minds back to the original analysis, the expectations are of a deeper retracement of the monthly bullish impulse to at least a 38.2% Fibonacci target.

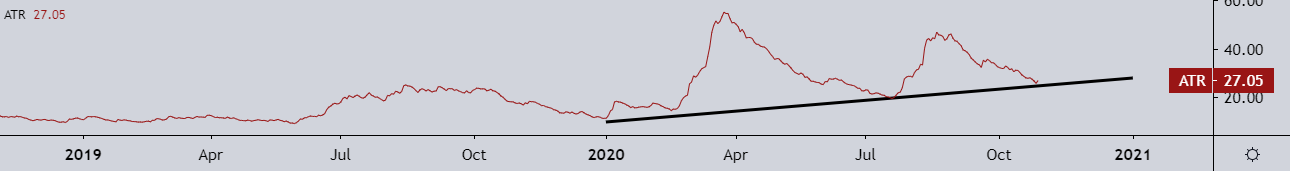
However, markets rarely move this far without offering a discount, especially in an asset class such as gold which is proving to be very choppy of late offer a higher ATR for the year 2020:

It is reasonable to expect a pullback to the prior support structures, which are now expected to act as resistance:

There is a cluster of Fibonacci retracement confluence with the various resistance structures. 

If the price does indeed hold below these, then the monthly 38.2% Fib in the $1,840 area is on the cards.

Gold levels


Overview
Today last price1877.07
Today Daily Change-30.73
Today Daily Change %-1.61
Today daily open1907.8
 
Trends
Daily SMA201903.35
Daily SMA501919.51
Daily SMA1001885.35
Daily SMA2001765.35
 
Levels
Previous Daily High1911.46
Previous Daily Low1897.92
Previous Weekly High1931.54
Previous Weekly Low1894.48
Previous Monthly High1992.42
Previous Monthly Low1848.82
Daily Fibonacci 38.2%1906.29
Daily Fibonacci 61.8%1903.09
Daily Pivot Point S11899.99
Daily Pivot Point S21892.19
Daily Pivot Point S31886.45
Daily Pivot Point R11913.53
Daily Pivot Point R21919.27
Daily Pivot Point R31927.07

Author

Ross J Burland

Ross J Burland, born in England, UK, is a sportsman at heart. He played Rugby and Judo for his county, Kent and the South East of England Rugby team.

More from Ross J Burland
Share:

Editor's Picks

EUR/USD climbs to daily highs on US CPI

EUR/USD now accelerates it rebound and flirts with the 1.1880 zone on Friday, or daily highs, all in response to renewed selling pressure on the US Dollar. In the meantime, US inflation figures showed the headline CPI rose less than expected in January, removing some tailwinds from the Greenback’s momentum.

GBP/USD clings to gains above 1.3600

GBP/USD reverses three consecutive daily pullbacks on Friday, hovering around the low-1.3600s on the back of the vacillating performance of the Greenback in the wake of the release of US CPI prints in January. Earlier in the day, the BoE’s Pill suggested that UK inflation could settle around 2.5%, above the bank’s goal.

Gold: Upside remains capped by $5,000

Gold is reclaiming part of the ground lost on Wednesday’s marked retracement, as bargain-hunters seem to have stepped in. The precious metal’s upside, however, appears limited amid the slightly better tone in the US Dollar after US inflation data saw the CPI rise less than estimated at the beginning of the year.

Crypto Today: Bitcoin, Ethereum, XRP in choppy price action, weighed down by falling institutional interest 

Bitcoin's upside remains largely constrained amid weak technicals and declining institutional interest. Ethereum trades sideways above $1,900 support with the upside capped below $2,000 amid ETF outflows.

Week ahead – Data blitz, Fed Minutes and RBNZ decision in the spotlight

US GDP and PCE inflation are main highlights, plus the Fed minutes. UK and Japan have busy calendars too with focus on CPI. Flash PMIs for February will also be doing the rounds. RBNZ meets, is unlikely to follow RBA’s hawkish path.

Solana Price Forecast: Mixed market sentiment caps recovery

Solana (SOL) is trading at $79 as of Friday, following a correction of over 9% so far this week. On-chain and derivatives data indicates mixed sentiment among traders, further limiting the chances of a price recovery.