![]() Elliott Wave Forecast Team
Elliott Wave Forecast Team
ElliottWave-Forecast.com
The VanEck Junior Gold Miners ETF (GDXJ) tracks small- and mid-cap gold and silver mining companies. Launched in 2009, it invests heavily in firms earning most of their revenue from mining or related activities. It appeals to investors seeking high-risk, high-reward exposure to precious metals. Below we will look at the Elliott Wave outlook of the ETF.
GDXJ monthly Elliott Wave view
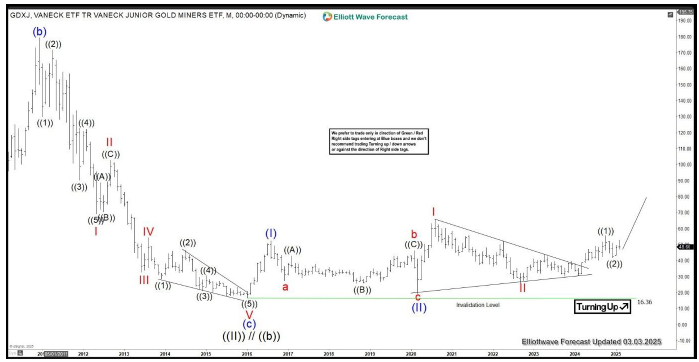
Monthly Elliott Wave Chart of GDXJ shows that the ETF made major low in 2016 at 16.36. We labelled this major bottom as wave ((II)). From there, the ETF rallied higher as a nest. Up from wave ((II), wave (I) ended at 52.5 and pullback in wave (II) ended at 19.52. The ETF nested higher in wave I at 65.95 and pullback in wave II ended at 25.8. Near term, while above 16.36, expect the ETF to extend higher.
GDXJ daily Elliott Wave view
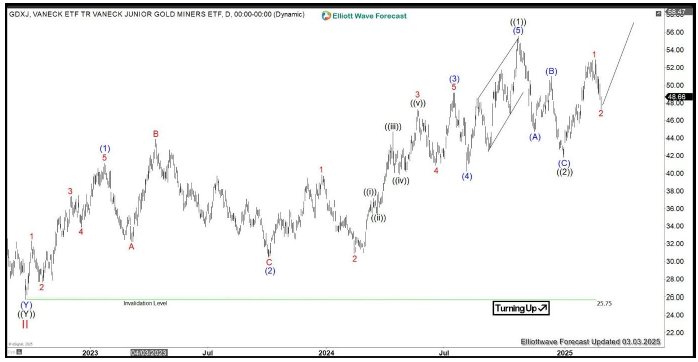
Daily Elliott Wave Chart of GDXJ shows dips to 25.79 ended wave II. The ETF then turned higher in wave III with internal subdivision as a 5 waves. Up from wave II, wave (1) ended at 41.16, and pullback in wave (2) ended at 30.46. The ETF resumed higher in wave (3) towards 49.13 and pullback in wave (4) ended at 40.26. Final leg wave (5) ended at 55.58 which completed wave ((1)) in higher degree. Pullback in wave ((2)) ended at 41.85 but the ETF needs to break above wave ((1)) to confirm the next leg higher has tarted. Near term, while above 25.75, expect the ETF to extend higher.
GDXJ four hour Elliott Wave view
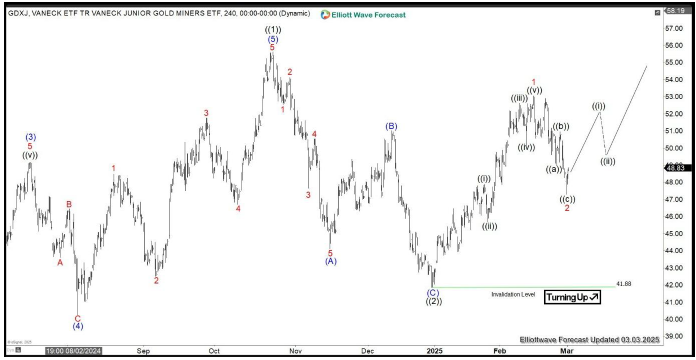
4 Hour Elliott Wave Chart of Gold Miners Junior ETF (GDXJ) above shows that cycle from 9.26.2022 low ended at 55.62 as wave ((1)). Pullback in wave ((2)) unfolded as a zigzag Elliott Wave structure. Down from wave ((1)), wave (A) ended at 44.11 and wave (B) ended at 51.03. Wave (C) lower ended at 41.88 which completed wave ((2)). The ETF has turned higher in wave ((3)). Up from wave ((2)), wave 1 ended at 53.05 and pullback in wave 2 ended at 47.29. Near term, while above 41.88, expect the ETF to extend higher.
GDXJ Elliott Wave video
FURTHER DISCLOSURES AND DISCLAIMER CONCERNING RISK, RESPONSIBILITY AND LIABILITY Trading in the Foreign Exchange market is a challenging opportunity where above average returns are available for educated and experienced investors who are willing to take above average risk. However, before deciding to participate in Foreign Exchange (FX) trading, you should carefully consider your investment objectives, level of xperience and risk appetite. Do not invest or trade capital you cannot afford to lose. EME PROCESSING AND CONSULTING, LLC, THEIR REPRESENTATIVES, AND ANYONE WORKING FOR OR WITHIN WWW.ELLIOTTWAVE- FORECAST.COM is not responsible for any loss from any form of distributed advice, signal, analysis, or content. Again, we fully DISCLOSE to the Subscriber base that the Service as a whole, the individual Parties, Representatives, or owners shall not be liable to any and all Subscribers for any losses or damages as a result of any action taken by the Subscriber from any trade idea or signal posted on the website(s) distributed through any form of social-media, email, the website, and/or any other electronic, written, verbal, or future form of communication . All analysis, trading signals, trading recommendations, all charts, communicated interpretations of the wave counts, and all content from any media form produced by www.Elliottwave-forecast.com and/or the Representatives are solely the opinions and best efforts of the respective author(s). In general Forex instruments are highly leveraged, and traders can lose some or all of their initial margin funds. All content provided by www.Elliottwave-forecast.com is expressed in good faith and is intended to help Subscribers succeed in the marketplace, but it is never guaranteed. There is no “holy grail” to trading or forecasting the market and we are wrong sometimes like everyone else. Please understand and accept the risk involved when making any trading and/or investment decision. UNDERSTAND that all the content we provide is protected through copyright of EME PROCESSING AND CONSULTING, LLC. It is illegal to disseminate in any form of communication any part or all of our proprietary information without specific authorization. UNDERSTAND that you also agree to not allow persons that are not PAID SUBSCRIBERS to view any of the content not released publicly. IF YOU ARE FOUND TO BE IN VIOLATION OF THESE RESTRICTIONS you or your firm (as the Subscriber) will be charged fully with no discount for one year subscription to our Premium Plus Plan at $1,799.88 for EACH person or firm who received any of our content illegally through the respected intermediary’s (Subscriber in violation of terms) channel(s) of communication.


Recommended content
Editors’ Picks

GBP/USD trades at fresh 2025-high above 1.3250 after UK CPI data
GBP/USD builds on its six-day winning streak and trades at its highest level since October above 1.3250 in the European session on Wednesday. The data from the UK showed that the annual CPI inflation softened to 2.6% in March from 2.8% in February but had little impact on Pound Sterling.

Gold price approaches $3,300 mark amid persistent safe-haven demand
Gold price continues scaling new record highs through the Asian session on Wednesday and has now moved well within striking distance of the $3,300 round-figure mark. Persistent worries about the escalating US-China trade war and US recession fears amid the ongoing US tariff chaos continue to boost demand for gold.

EUR/USD rises to near 1.1350 ahead of Eurozone HICP inflation data
EUR/USD is trading around 1.1340 during the Asian hours on Wednesday, rebounding after two consecutive sessions of losses. The pair is drawing support from a more positive global risk sentiment, buoyed by US President Donald Trump's decision to exempt key technology products from his newly announced “reciprocal” tariffs.

Exchange inflows surge as XRP slides, what comes next?
Ripple corrected along with other major digital assets, including Bitcoin and Ethereum, and traded at $2.08 at the time of writing on Wednesday. The drawdown cut across the crypto market, causing the total capitalization to drop 3.2% to $2.736 trillion.

Is a recession looming?
Wall Street skyrockets after Trump announces tariff delay. But gains remain limited as Trade War with China continues. Recession odds have eased, but investors remain fearful. The worst may not be over, deeper market wounds still possible.

The Best brokers to trade EUR/USD
SPONSORED Discover the top brokers for trading EUR/USD in 2025. Our list features brokers with competitive spreads, fast execution, and powerful platforms. Whether you're a beginner or an expert, find the right partner to navigate the dynamic Forex market.