Gold falls as USD finds a floor and recovers
- Gold price is weakening on Tuesday on the back of a rise in the US Dollar.
- The USD’s recent decline was due to weak US jobs data, but Fed commentary put a floor under the sell-off.
- Fed policymakers made it clear they are still not in a hurry to cut interest rates, boosting the Greenback.

The Gold price (XAU/USD) trades down by roughly a third of a percent, in the $2,310s on Tuesday, as the US Dollar (USD) recovers, reducing the cost of Gold which is priced in USD.
Gold price declines on stronger Dollar
Gold price declines on Tuesday after a rebound in the US Dollar reduces the cost of the precious metal in USD terms.
Although last week’s US Nonfarm Payrolls data showed a weakening labor market that suggested the Federal Reserve (Fed) might cut interest rates sooner than had been anticipated, commentary from Fed members over the last few days continued to show a reluctance by policymakers to hurry lowering borrowing costs.
On Monday, Richmond Fed President Thomas Barkin said that the current interest rate level should cool the economy enough to bring down inflation to the Fed’s 2.0% target but that it would be a "stubborn road back," and that, "It doesn't mean you won't get it back. It just means it takes a while”.
Meanwhile, New York Fed President John Williams stated that there would be rate cuts eventually and that he saw job growth moderating, but that the Fed would be looking at the “totality” of data before making its decision.
Markets have priced in rate cuts worth 46 basis points (bps) from the Fed by the end of 2024, with the first cut expected in September or November, according to LSEG's rate probability app, according to FXStreet’s Editor Lallalit Srijandorn.
Technical Analysis: Gold price meets resistance at top of range
Gold price (XAU/USD) has retested the ceiling of a mini-range at around $2,326, and retreated. It is currently finding support at around the 50 Simple Moving Average (SMA) at the 4-hour chart at $2,317.
XAU/USD 4-hour Chart
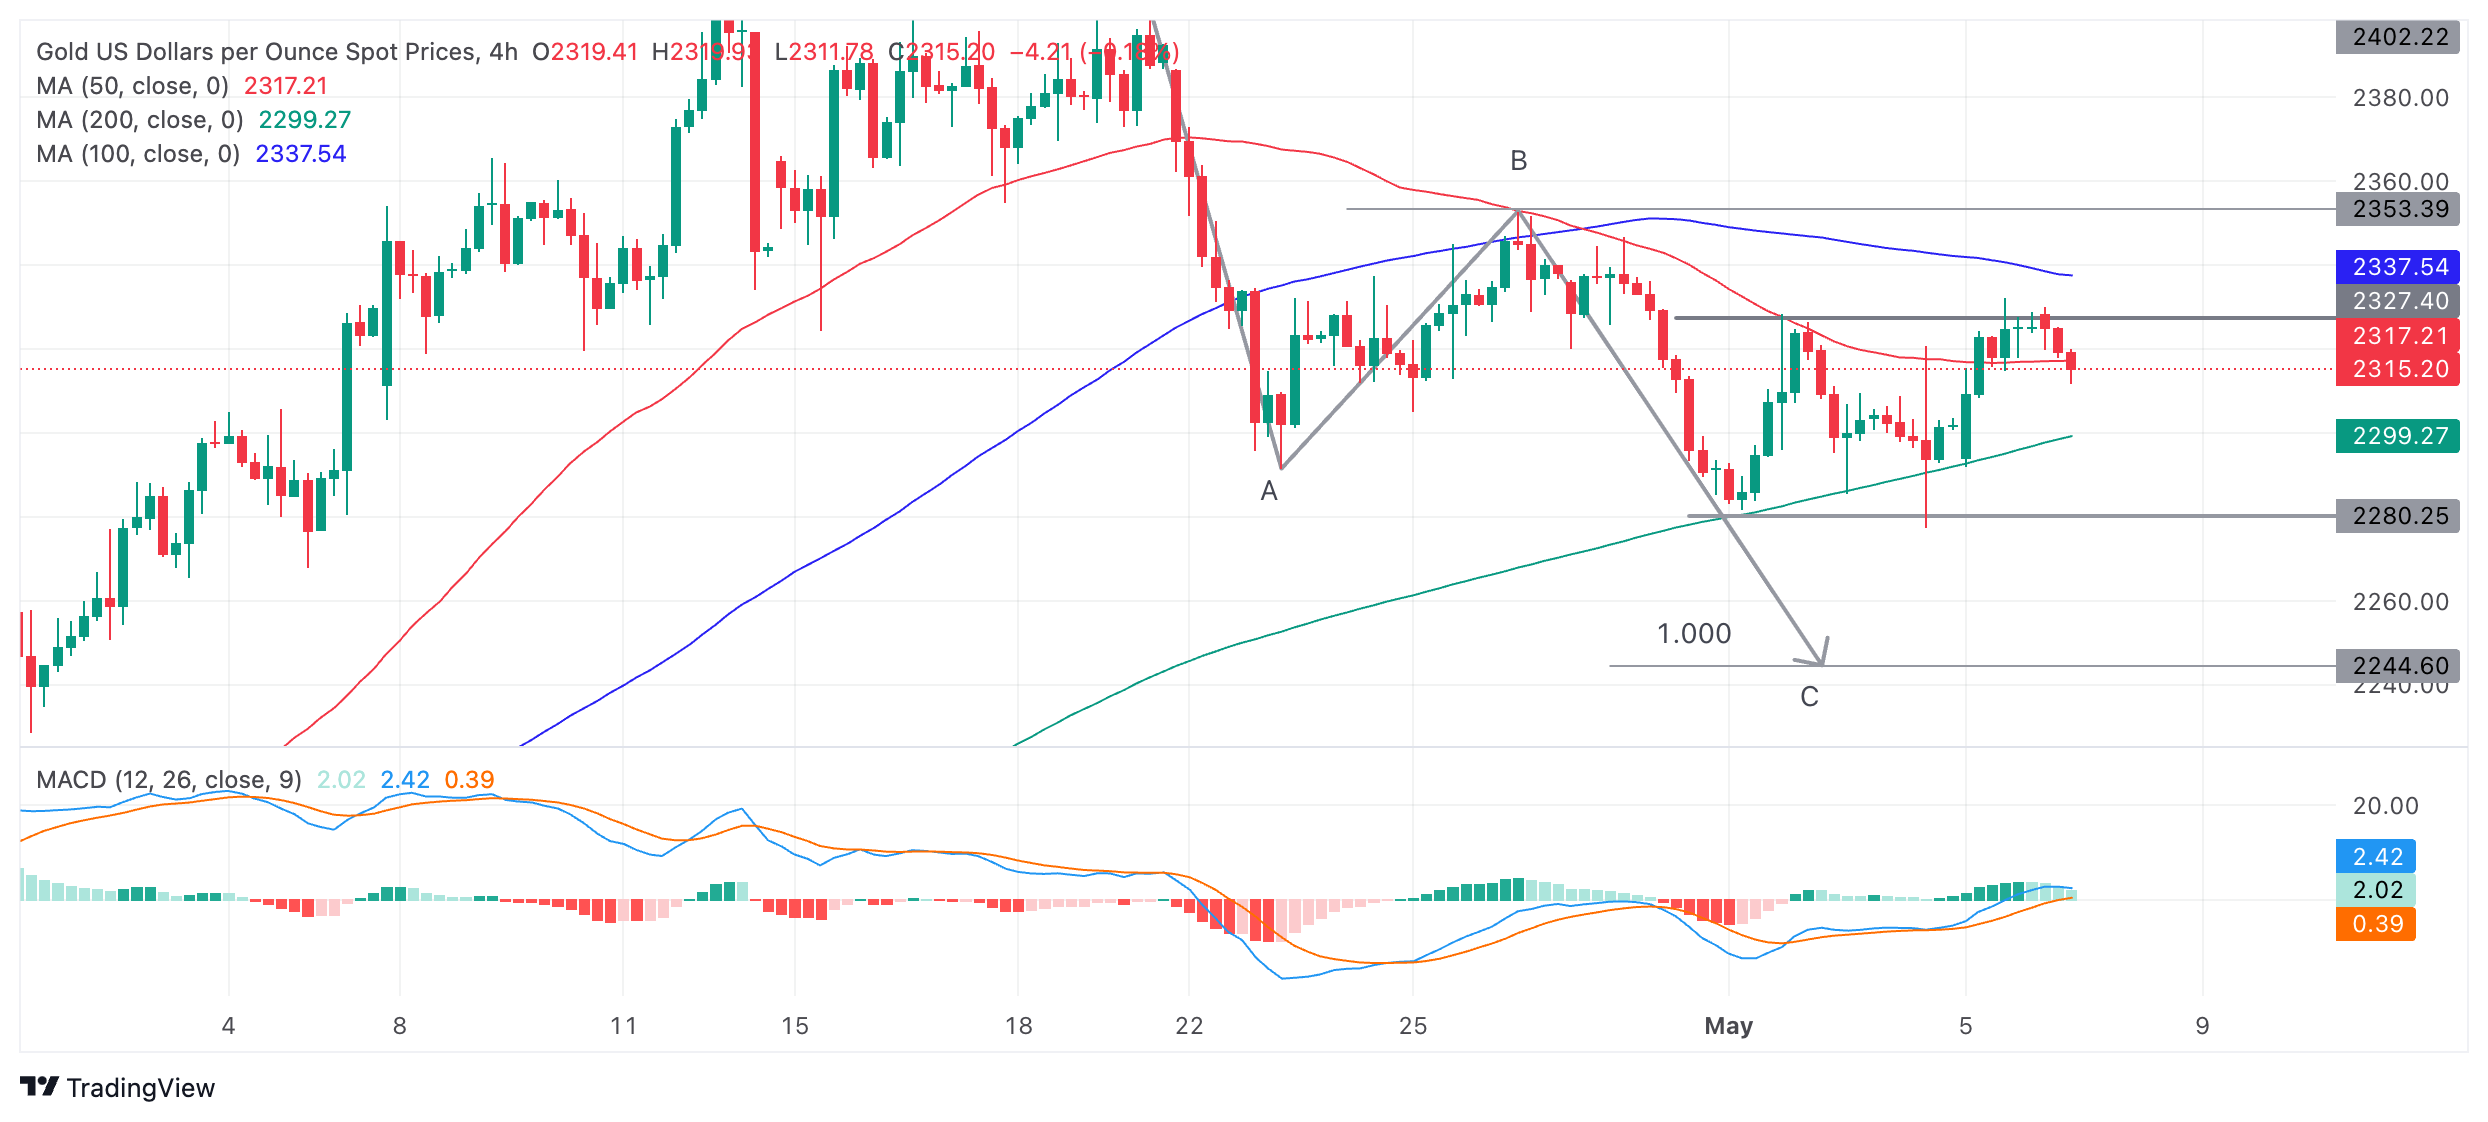
Price could potentially pull back further and fall to the base of the range at around $2,280. Support from the 200 SMA and prior lows at around $2,300 could provide an obstacle on the way down.
On the other hand, a decisive break out of the top of the range would signal a likely move up to a conservative target at $2,353 – the top of wave B and the 0.681 Fibonacci extension of the height of the range extrapolated higher. In a bullish case, it could even possibly hit $2,370.
A decisive break would be one characterized by a longer-than-average green candlestick that pierces above the range ceiling, and closes near its high; or three green candlesticks in a row that pierce above the respective level.
Unfinished Measured Move
Gold price is potentially still in the middle of unfolding a bearish Measured Move price pattern which began on April 19.
Measured Moves are zig-zag type patterns composed of three waves labeled A, B and C, with C usually equalling the length of A or a Fibonnaci 0.681 of A. Price has fallen to the conservative estimate for wave C at $2,286, the Fibonacci 0.681 of wave A.
Wave C could still go lower, however, and reach the 100% extrapolation of A at $2,245. Such a move would be confirmed by a decisive break below the range and the May 3 low at $2,277.
The trend for Gold price is up on both the medium and long-term charts (daily and weekly), overall adding a supportive backdraft to the outlook.
US Dollar FAQs
The US Dollar (USD) is the official currency of the United States of America, and the ‘de facto’ currency of a significant number of other countries where it is found in circulation alongside local notes. It is the most heavily traded currency in the world, accounting for over 88% of all global foreign exchange turnover, or an average of $6.6 trillion in transactions per day, according to data from 2022. Following the second world war, the USD took over from the British Pound as the world’s reserve currency. For most of its history, the US Dollar was backed by Gold, until the Bretton Woods Agreement in 1971 when the Gold Standard went away.
The most important single factor impacting on the value of the US Dollar is monetary policy, which is shaped by the Federal Reserve (Fed). The Fed has two mandates: to achieve price stability (control inflation) and foster full employment. Its primary tool to achieve these two goals is by adjusting interest rates. When prices are rising too quickly and inflation is above the Fed’s 2% target, the Fed will raise rates, which helps the USD value. When inflation falls below 2% or the Unemployment Rate is too high, the Fed may lower interest rates, which weighs on the Greenback.
In extreme situations, the Federal Reserve can also print more Dollars and enact quantitative easing (QE). QE is the process by which the Fed substantially increases the flow of credit in a stuck financial system. It is a non-standard policy measure used when credit has dried up because banks will not lend to each other (out of the fear of counterparty default). It is a last resort when simply lowering interest rates is unlikely to achieve the necessary result. It was the Fed’s weapon of choice to combat the credit crunch that occurred during the Great Financial Crisis in 2008. It involves the Fed printing more Dollars and using them to buy US government bonds predominantly from financial institutions. QE usually leads to a weaker US Dollar.
Quantitative tightening (QT) is the reverse process whereby the Federal Reserve stops buying bonds from financial institutions and does not reinvest the principal from the bonds it holds maturing in new purchases. It is usually positive for the US Dollar.
Author

Joaquin Monfort
FXStreet
Joaquin Monfort is a financial writer and analyst with over 10 years experience writing about financial markets and alt data. He holds a degree in Anthropology from London University and a Diploma in Technical analysis.


