GME Stock Price and Forecast: When does Gamestop report earnings?
- GameStop (GME) stock surged over 6% on Tuesday as risk aversion faded.
- GameStop (GME) shares rallied as risk names and meme stocks surged.
- Omicron hit all stocks, but the meme space has higher volatility.
GameStop (GME) rallied back to life on Tuesday as a risk-on mode floated all stockmarket boats higher. The main indices put in impressive rallies after a tough start to the month. The traditional Santa rally may yet be on the cards. Bitcoin suffered a serious stumble over the weekend, retreating back to nearly $40,000, but by Tuesday it has steadied and was back above $50,000, signaling that risk was definitely back on. The meme stock space took its cue from the crypto king and duly rallied sharply.
-637745600491663688.png)
GameStop (GME) chart, 15 minute
GameStop (GME) stock is still down 26% since the highs from late November. We had previously identified this as a bearish double top, which is clear from our daily char below.
GameStop (GME) stock news
The timing of the latest rally was perfect as momentum could be added to by a good set of earnings today. GameStop (GME) earnings are out after the close today. There is a conference call at 1700 EST/2200 GMT. The link for the call is here. GameStop (GME) is expected to report earnings per share (EPS) of -$0.52 for the third quarter on revenues of $1.19 billion. The last earnings report on September 8 saw some volatility, but the stock ended largely unchanged. EPS missed, but revenue came in ahead of forecasts for Q2.
GameStop (GME) stock forecast
Forecasting this one into earnings, the easiest call to make is that volatility will be elevated. This means buying options is expensive and traders should consider option purchases carefully. Volatility always spikes before earnings, meaning options are more expensive. This means theta (time decay) is higher, so options lose money daily even if nothing else changes. The double top at $250 is what did the real damage to GME. Now GME stock is trading below the significant 200-day moving average at $188. This is the big resistance to get back above. Support from the yearly Volume-Weighted Averge Price (VWAP) is at $139.58.
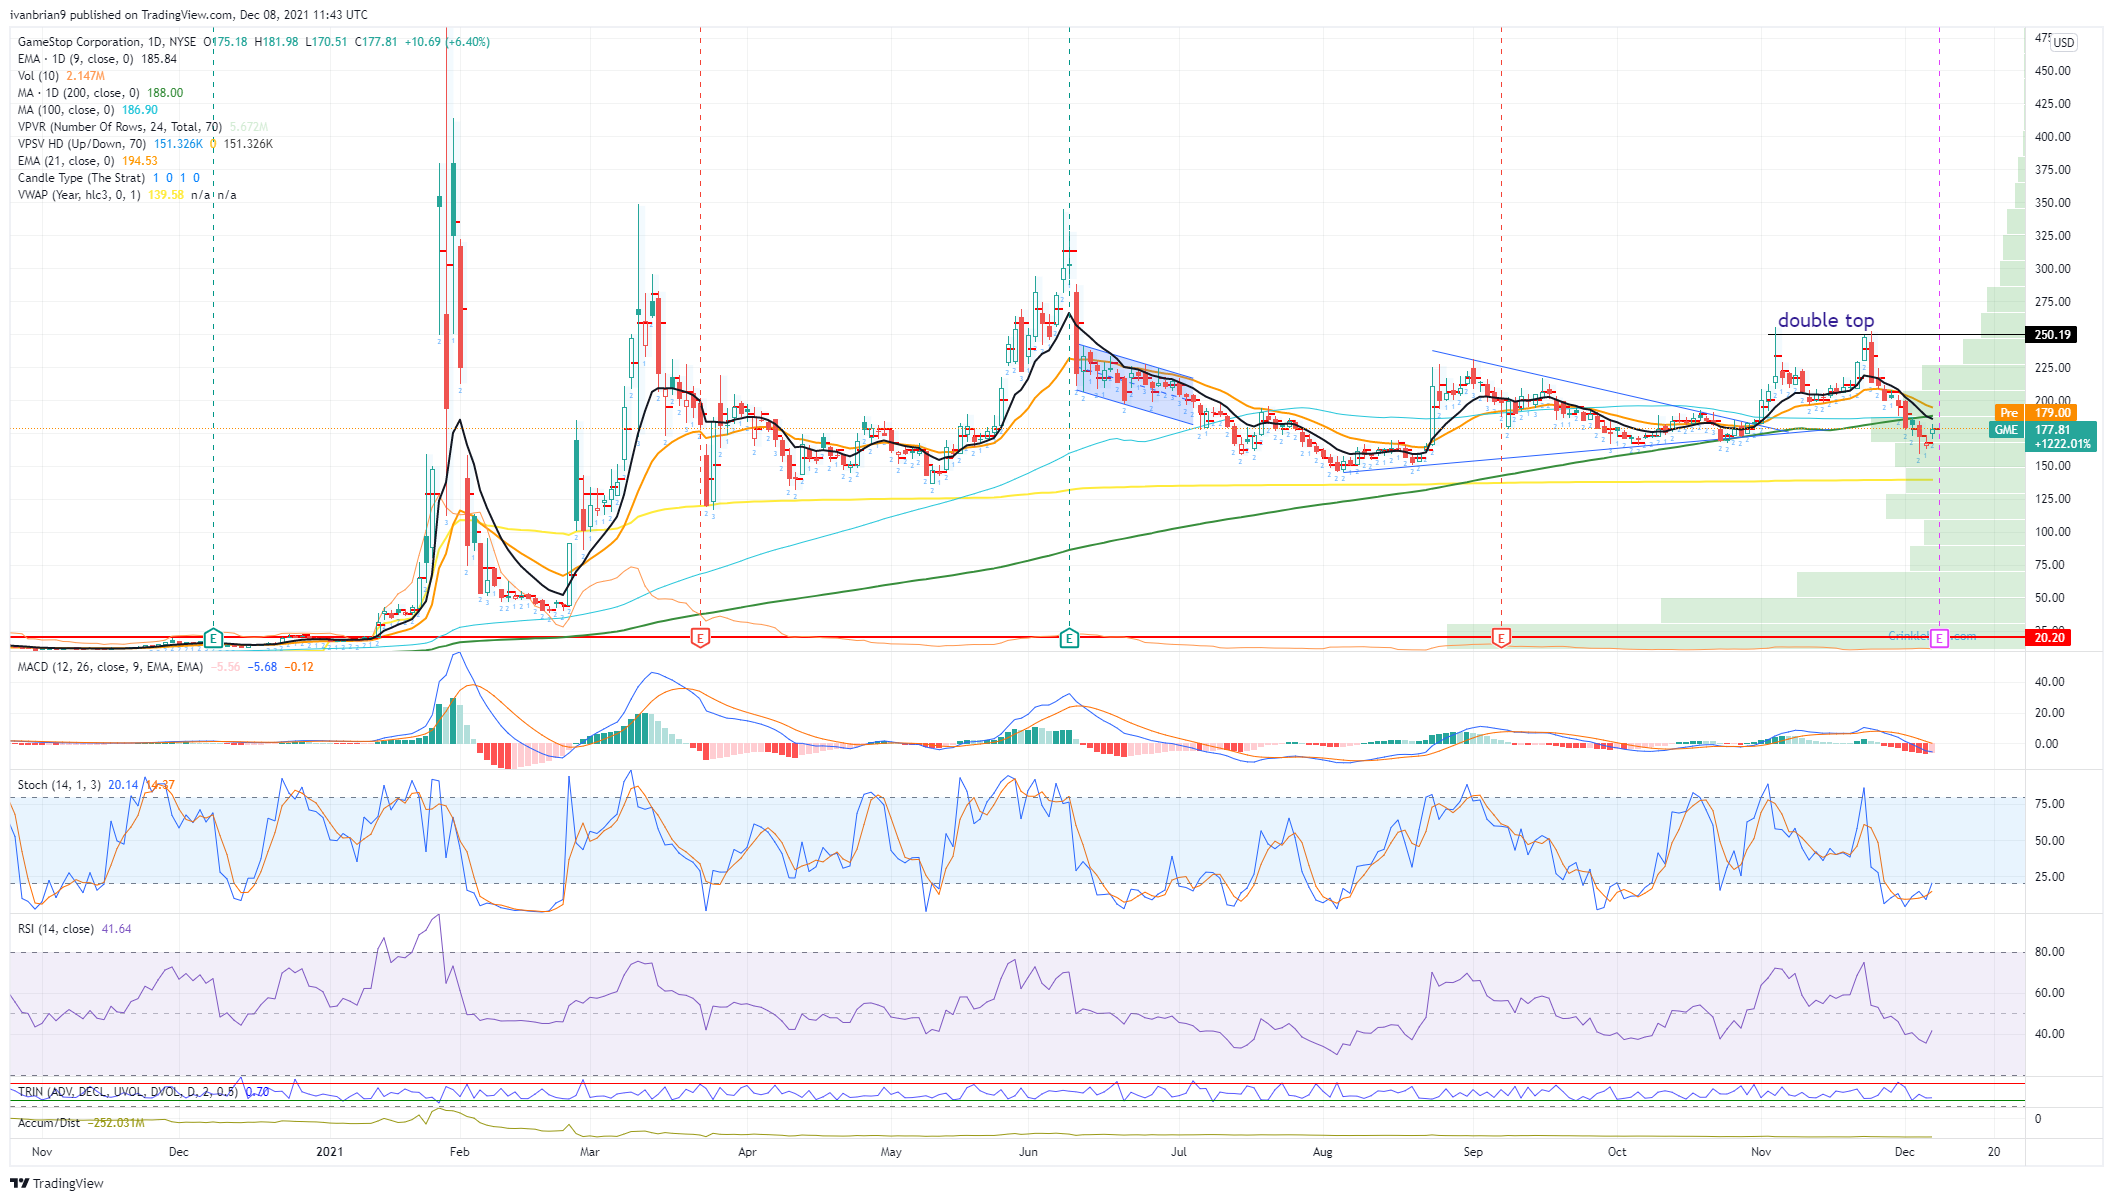
GME daily chart
Like this article? Help us with some feedback by answering this survey:
Premium
You have reached your limit of 3 free articles for this month.
Start your subscription and get access to all our original articles.
Author

Ivan Brian
FXStreet
Ivan Brian started his career with AIB Bank in corporate finance and then worked for seven years at Baxter. He started as a macro analyst before becoming Head of Research and then CFO.


