|

General Electric (GE) continued rally after Elliott Wave triangle pattern

In this technical blog we’re going to take a quick look at the Elliott Wave charts of General Electric ( GE ), published in members area of the website.  As our members know, GE has recently given sideways correction in wave (4) that has completed as Elliott Wave Triangle pattern.  The stock made the rally after completing the sideways correction.  In the further text we are going to explain the Elliott Wave Pattern and the forecast. Before we take a look at the real market example, let’s explain Elliott Wave Triangle Pattern

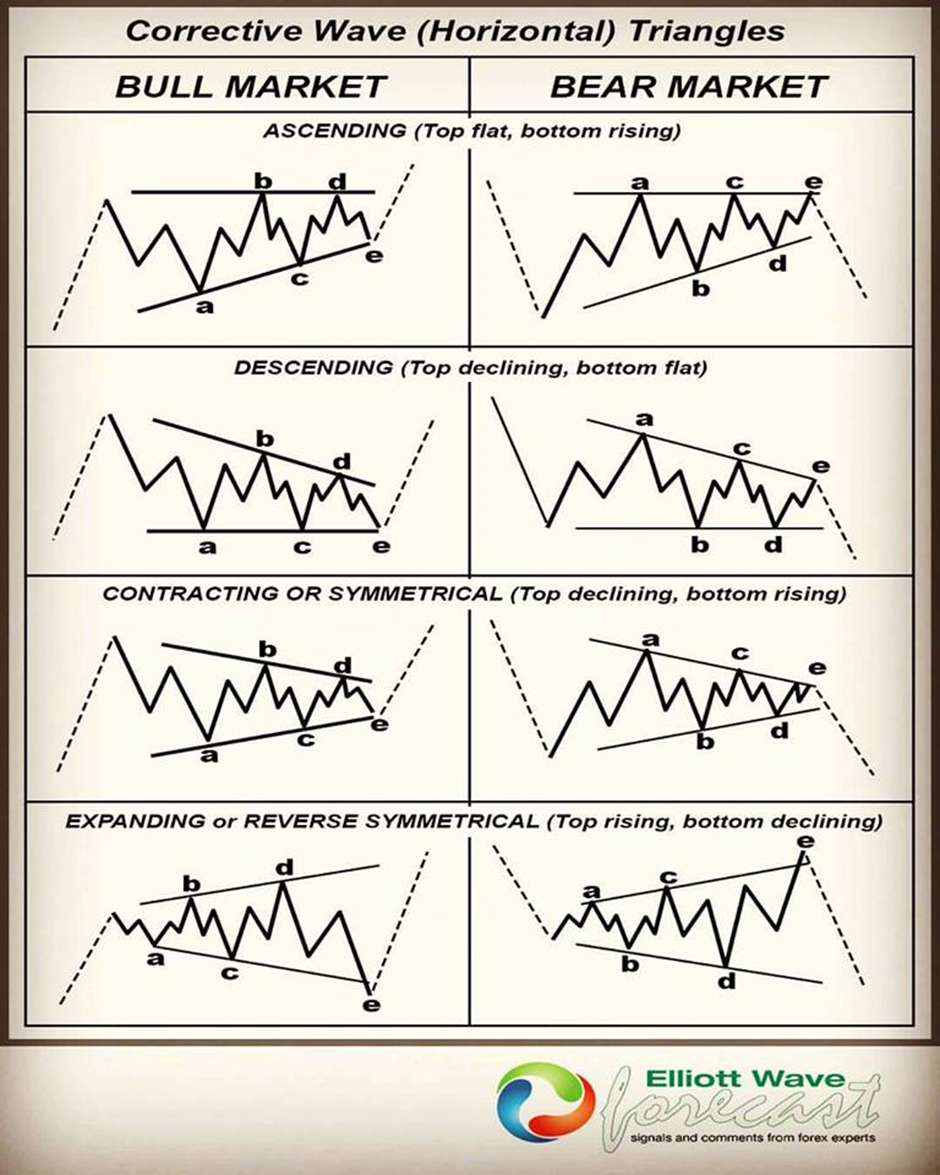
At the chart below we can see what Elliott Wave Triangle pattern looks like in real market.

Chart

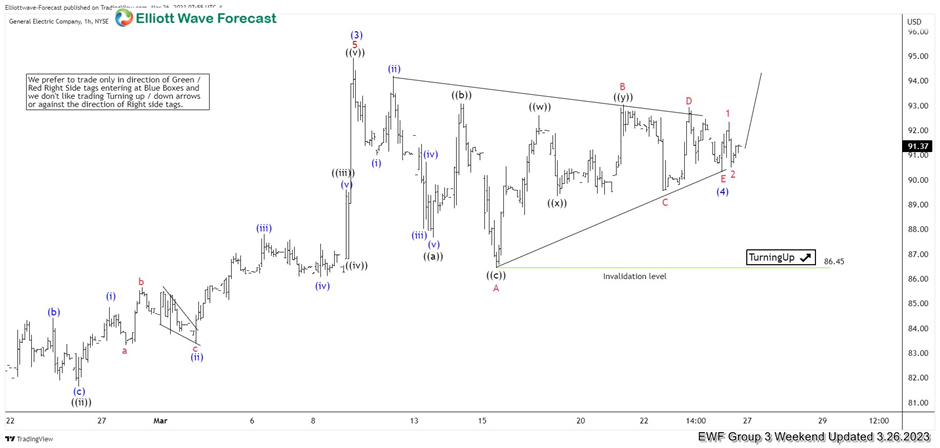
GE H1 London update 03.26.2023

GE has given us sideways consolidation in wave (4) blue correction. We got sideways consolidation, the stock made contractions in both price and momentum. Now, we can count clear 5 waves within the pattern. Each one has corrective sequences.  Consequently we believe that wave (4)  could have ended as a Triangle Pattern. We are looking for further strength in the stock. Once we get break of (3) blue peak, the price will confirm that next leg up is in progress toward 96.18-98.2 area.

Chart

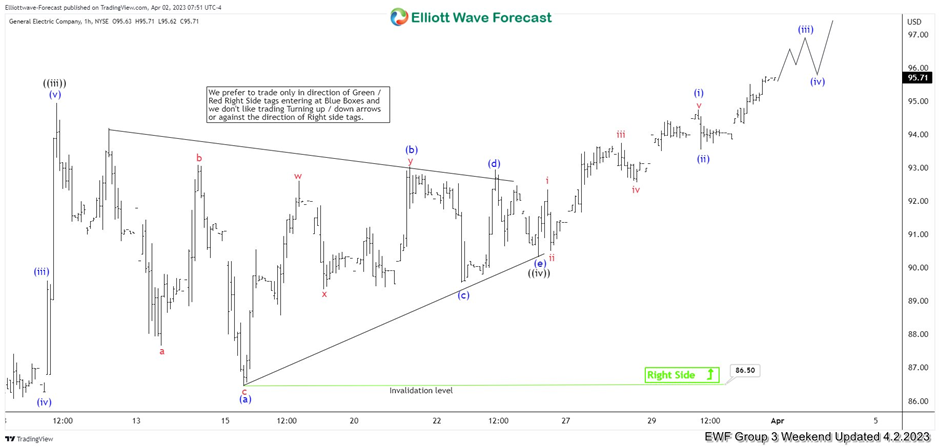
GE H1 London update 04.02.2023

The price break upper line of triangle. As a result we got continuation higher as expected. Once the stock broke previous peak at  94.9, we got confirmation that we should ideally see extension up toward 96.18-98.2 area at least.

Chart

Author

Elliott Wave Forecast Team

Elliott Wave Forecast Team

ElliottWave-Forecast.com

More from Elliott Wave Forecast Team
Share:

Markets move fast. We move first.

Orange Juice Newsletter brings you expert driven insights - not headlines. Every day on your inbox.

By subscribing you agree to our Terms and conditions.

Editor's Picks

EUR/USD flatlines below 1.1800 ahead of Fed Minutes

EUR/USD struggles to find direction and continues to move sideways below 1.1800 for the second consecutive day on Tuesday as markets remain in holiday mood. Later in the American session, the Federal Reserve will publish the minutes of the December policy meeting.

GBP/USD retreats to 1.3500 area following earlier climb

GBP/USD loses its traction and trades flat on the day near 1.3500 after rising to the 1.3530 area early Tuesday. Trading conditions remain thin ahead of the New Year holiday, limiting the pair's volatility. The Fed will publish December meeting minutes in the late American session.

Gold aims to regain the ground lost

Gold gathers recovery momentum and advances toward $4,400 on Tuesday after losing more than 4% on Monday. Increased margin requirements on gold and silver futures by the Chicago Mercantile Exchange Group, one of the world’s largest trading floors for commodities, prompted widespread profit-taking and portfolio rebalancing.

Tron steadies as Justin Sun invests $18 million in Tron Inc.

Tron (TRX) trades above $0.2800 at press time on Monday, hovering below the 50-day Exponential Moving Average (EMA) at $0.2859.

Economic outlook 2026-2027 in advanced countries: Solidity test

After a year marked by global economic resilience and ending on a note of optimism, 2026 looks promising and could be a year of solid economic performance. In our baseline scenario, we expect most of the supportive factors at work in 2025 to continue to play a role in 2026.

Crypto market outlook for 2026

Year 2025 was volatile, as crypto often is.  Among positive catalysts were favourable regulatory changes in the U.S., rise of Digital Asset Treasuries (DAT), adoption of AI and tokenization of Real-World-Assets (RWA).