GBP/USD technical analysis: Struggles between 21-day EMA, 23.6% Fibo.
- GBP/USD refrains from declining below 21-day EMA.
- 23.6% Fibonacci retracement of May-August declines limit short-term advances.

GBP/USD struggles between 23.6% Fibonacci retracement of its three-month-old downpour and 21-day exponential moving average (EMA) as it trades near 1.2225 ahead of the UK open on Tuesday.
While pair’s failure to extend two-week long recovery beyond immediate resistance increases the odds of its south-run, 21-day EMA and a fortnight old rising trend-line question sellers.
In doing so, 1.2207 and 1.2100 acts as nearby supports ahead of monthly bottom surrounding 1.2015.
If the pair manages to cross 1.2290 resistance level, including 23.6% Fibonacci retracement, July 17 low near 1.2382 and 38.2% Fibonacci retracement around 1.2460 might as well lure buyers.
GBP/USD daily chart
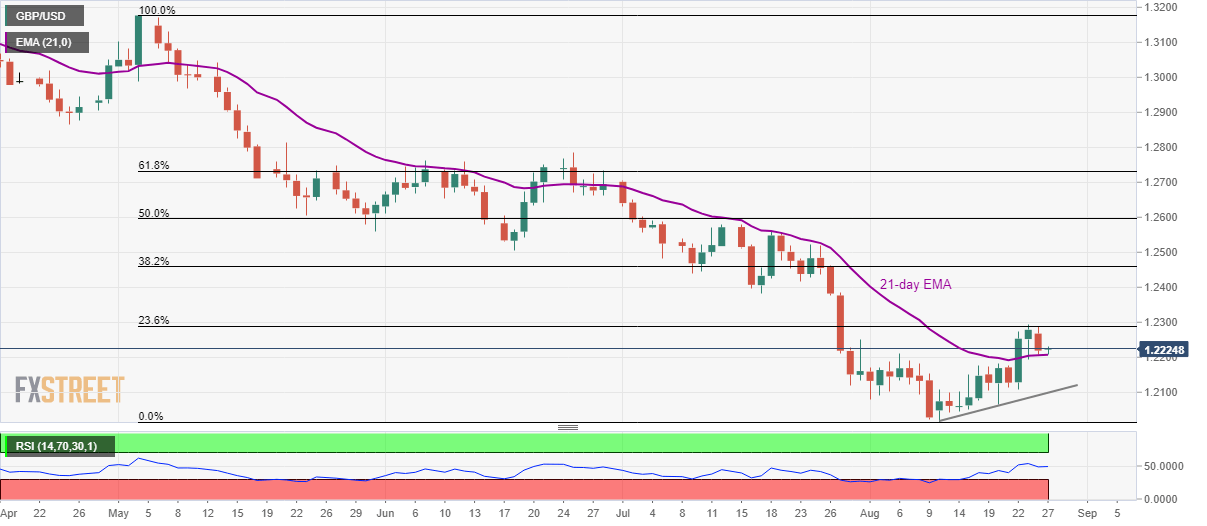
Trend: Sideways
Author

Anil Panchal
FXStreet
Anil Panchal has nearly 15 years of experience in tracking financial markets. With a keen interest in macroeconomics, Anil aptly tracks global news/updates and stays well-informed about the global financial moves and their implications.


