|

GBP/USD Technical Analysis: Sterling pierces through 1.2600 figure as USD weakens across the board
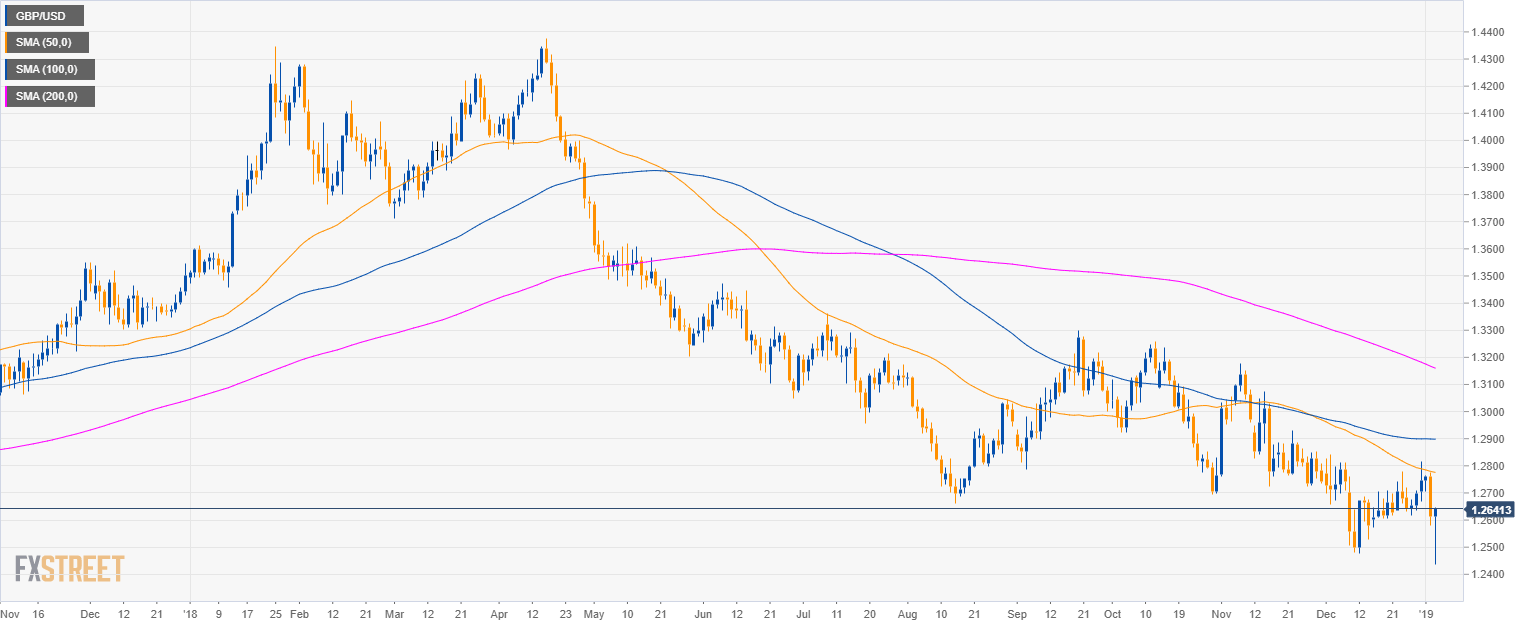
GBP/USD daily chart

  • GBP/USD is trading in a bear trend below the 200-period simple moving average (SMA).

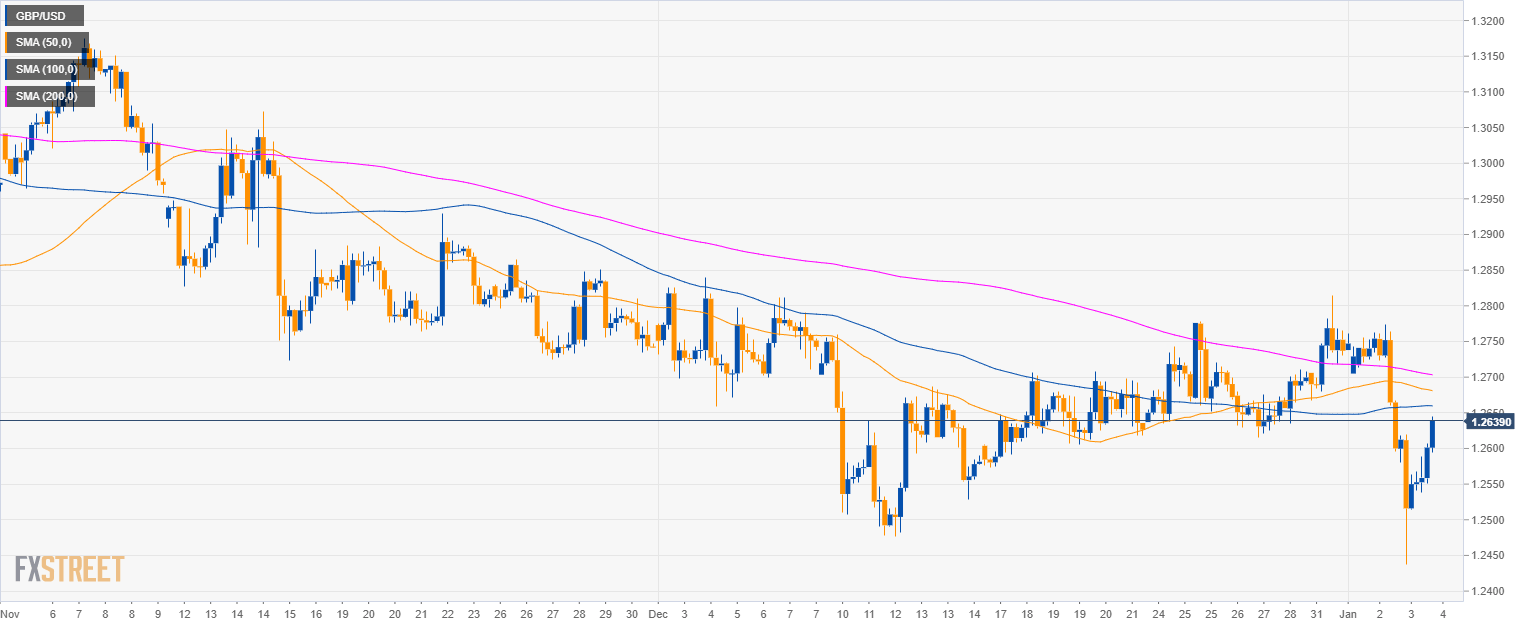
GBP/USD 4-hour chart

  • GBP/USD is trading below its main SMAs suggesting that the momentum is bearish.

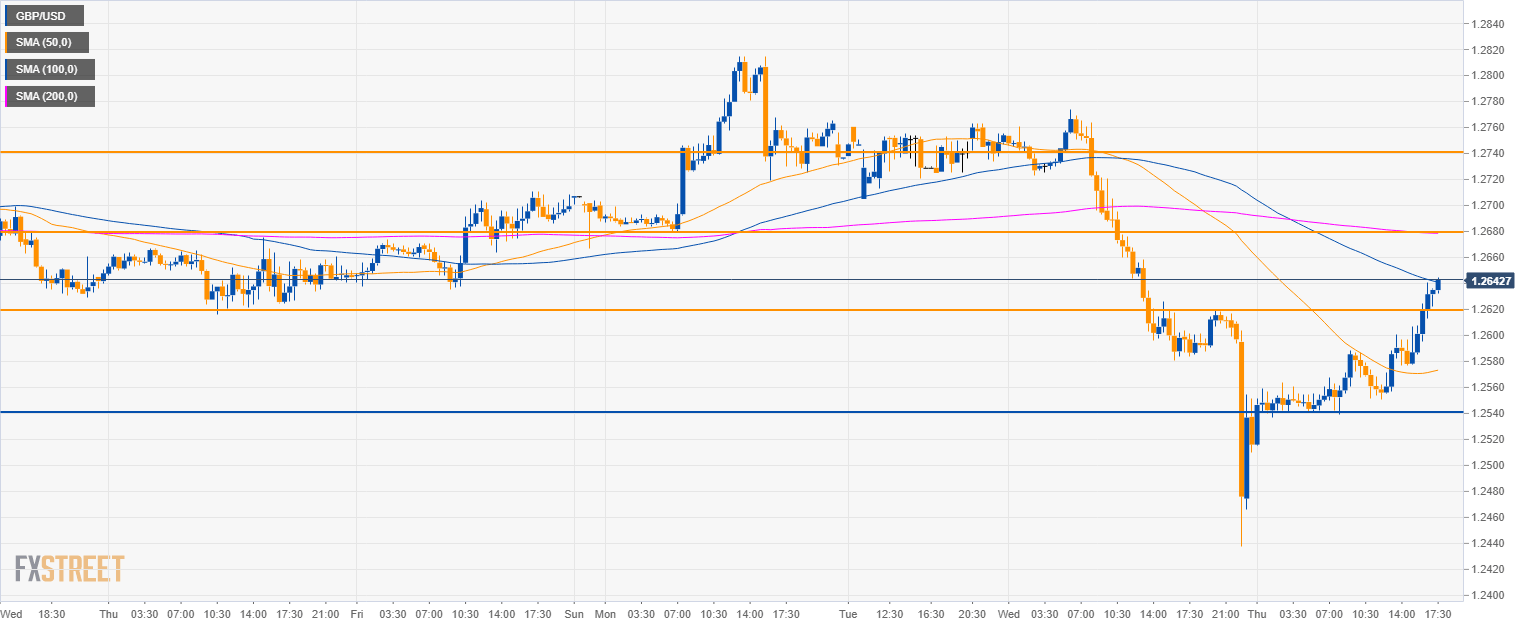
GBP/USD 30-minute chart

  • GBP/USD broke above the 1.2600 figure and is testing the 100 SMA.
  • If bulls keep the market above 1.2620 then an extension to 1.2680 can be on the cards.
  • On the flip side, a break below 1.2620 could see a retest of the 1.2540 level.

Additional key levels

GBP/USD

Overview:
    Today Last Price: 1.2635
    Today Daily change: 23 pips
    Today Daily change %: 0.182%
    Today Daily Open: 1.2612
Trends:
    Previous Daily SMA20: 1.2658
    Previous Daily SMA50: 1.2779
    Previous Daily SMA100: 1.2898
    Previous Daily SMA200: 1.317
Levels:
    Previous Daily High: 1.2774
    Previous Daily Low: 1.2581
    Previous Weekly High: 1.2778
    Previous Weekly Low: 1.2616
    Previous Monthly High: 1.284
    Previous Monthly Low: 1.2477
    Previous Daily Fibonacci 38.2%: 1.2655
    Previous Daily Fibonacci 61.8%: 1.27
    Previous Daily Pivot Point S1: 1.2537
    Previous Daily Pivot Point S2: 1.2463
    Previous Daily Pivot Point S3: 1.2344
    Previous Daily Pivot Point R1: 1.273
    Previous Daily Pivot Point R2: 1.2849
    Previous Daily Pivot Point R3: 1.2923

Author

Flavio Tosti

Flavio Tosti

Independent Analyst


More from Flavio Tosti
Share:

Editor's Picks

EUR/USD strengthens above 1.1800 ahead of German IFO data

EUR/USD gains ground for the second successive session, holding well above 1.1800 in the European session on Monday. The US Dollar remains heavy as a 'Sell America' theme returns to the fore amid uncertainty fuelled by US President Trump's latest tariff announcement. German IFO Survey could offer fresh trading impetus. 

GBP/USD rises toward 1.3550 as tariff confusion slams USD

GBP/USD extends the advance toward 1.3550 on Monday. The US Dollar faces intense selling pressure as tariff uncertainty lingers following US President Trump's latest announcement. Traders will take more cues from the broader market sentiment and central bank talks. 

Gold clings to gains near monthly peak amid flight to safety and weak USD

Gold sticks to its bullish bias near the monthly peak heading into the European session and looks to build on last week's breakout through the $5,100 mark amid a supportive fundamental backdrop. Renewed trade-war fears, along with rising geopolitical tensions in the Middle East, turn out to be key factors that underpin the safe-haven precious metal and validate the constructive outlook.

Cardano braces for impact as US tariff storm brews

Cardano is down 4% at press time on Monday, entering its third consecutive day of decline. Bearish bias in Cardano’s derivatives market positional buildup aligns with rising pressure on the broader cryptocurrencymarket amid US President Donald Trump's reassessment of global tariffs and domestic conflict with the US Supreme Court. 

Liberation day take two, the tariff machine just changed gears

Let me caveat this from the outset. What we are watching is first-order mechanics, not the grand macro endgame. This is the market’s immediate reflex to a 15% Trump tariff levy dressed up as judicial drama. The Supreme Court blocked Trump tarrif hammer. The White House came back with a scalpel.

Top Crypto Losers: Zcash, Pump.fun, and LayerZero extended losses as Bitcoin loses $65,000

The cryptocurrency market starts the week in panic mode, with altcoins Zcash, Pump.fun, and LayerZero. Bitcoin falls below $65,000 as the US President Donald Trump regroups amid renewed trade policy risks.