|

GBP/USD Technical Analysis: Cable trades near session’s highs above the 1.2900 handle

  • The cable closed the weekly opening gap at the start of the New York session.
  • The level to beat for bulls is the 1.2953 resistance.
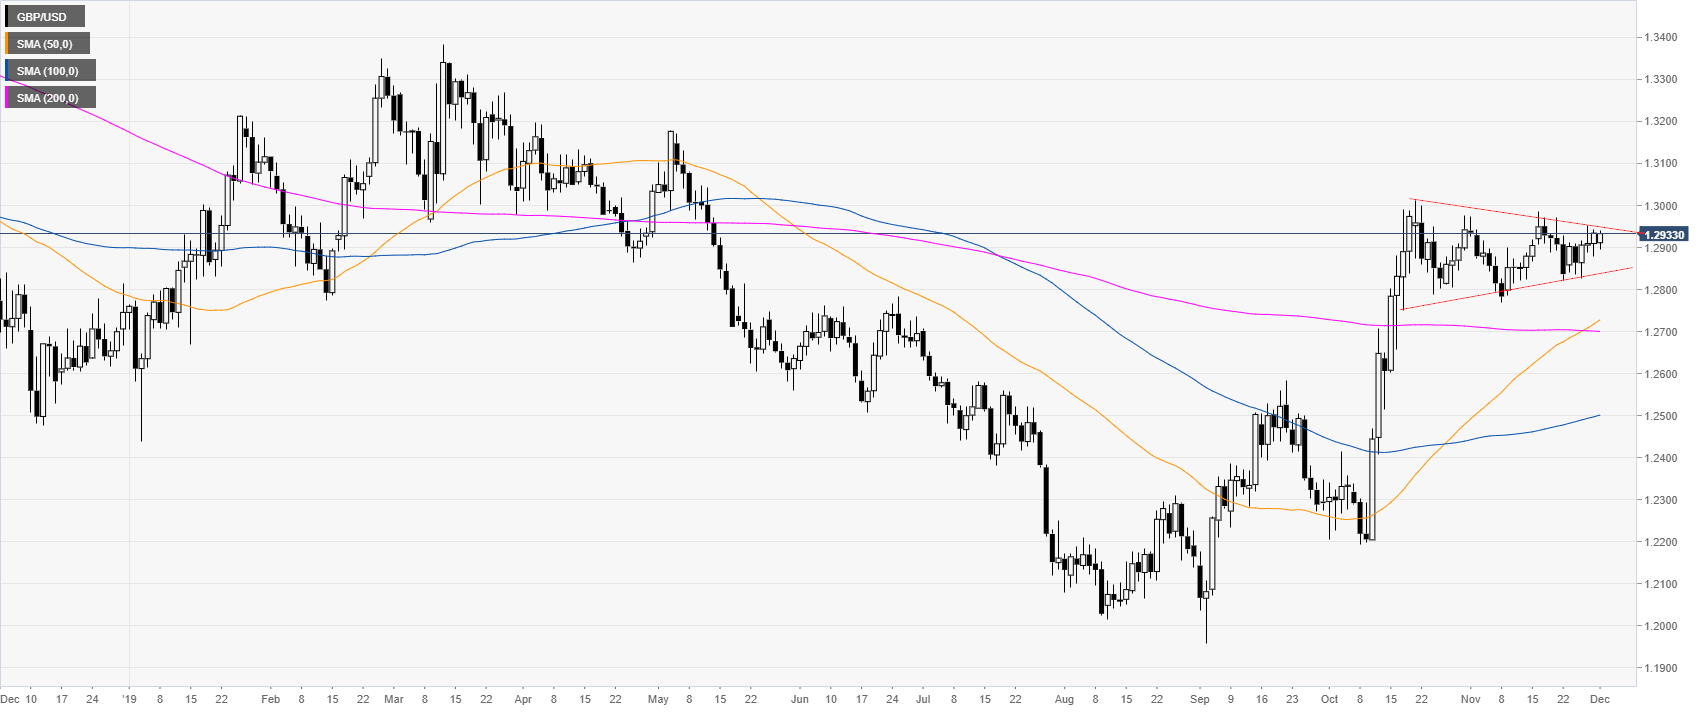


GBP/USD daily chart

 
The market is starting December holding above the 1.2900 handle while trading above the main SMAs. The market in November consolidated the October gains in a triangle formation.
 

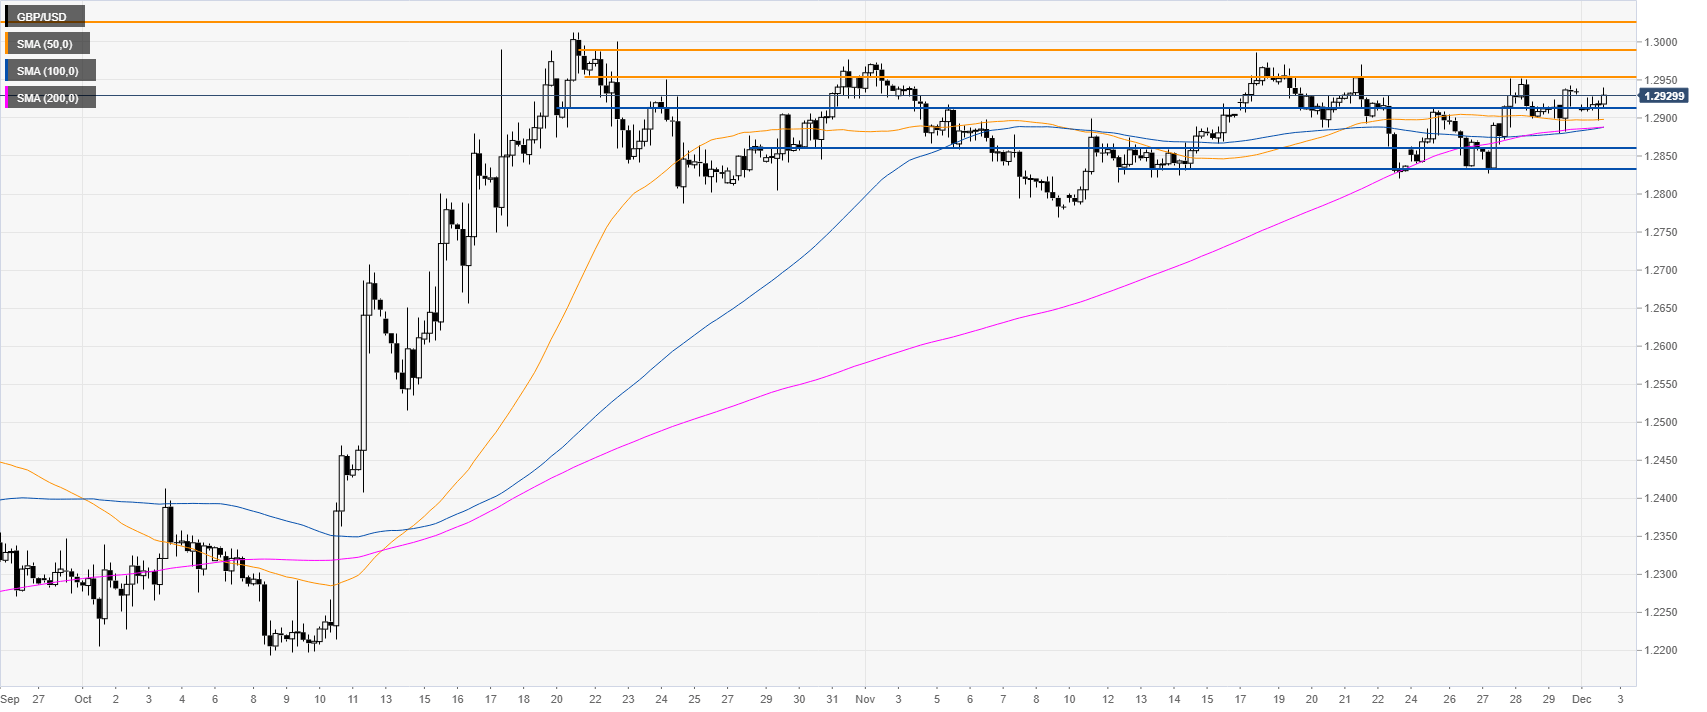
GBP/USD four-hour chart

 
The market is trading quietly above the main SMAs. As the underlying bias is bullish, the buyers will likely try to break above the 1.2953 resistance to reach the 1.2990 and 1.3025 levels on the way up, according to the Technical Confluences Indicator

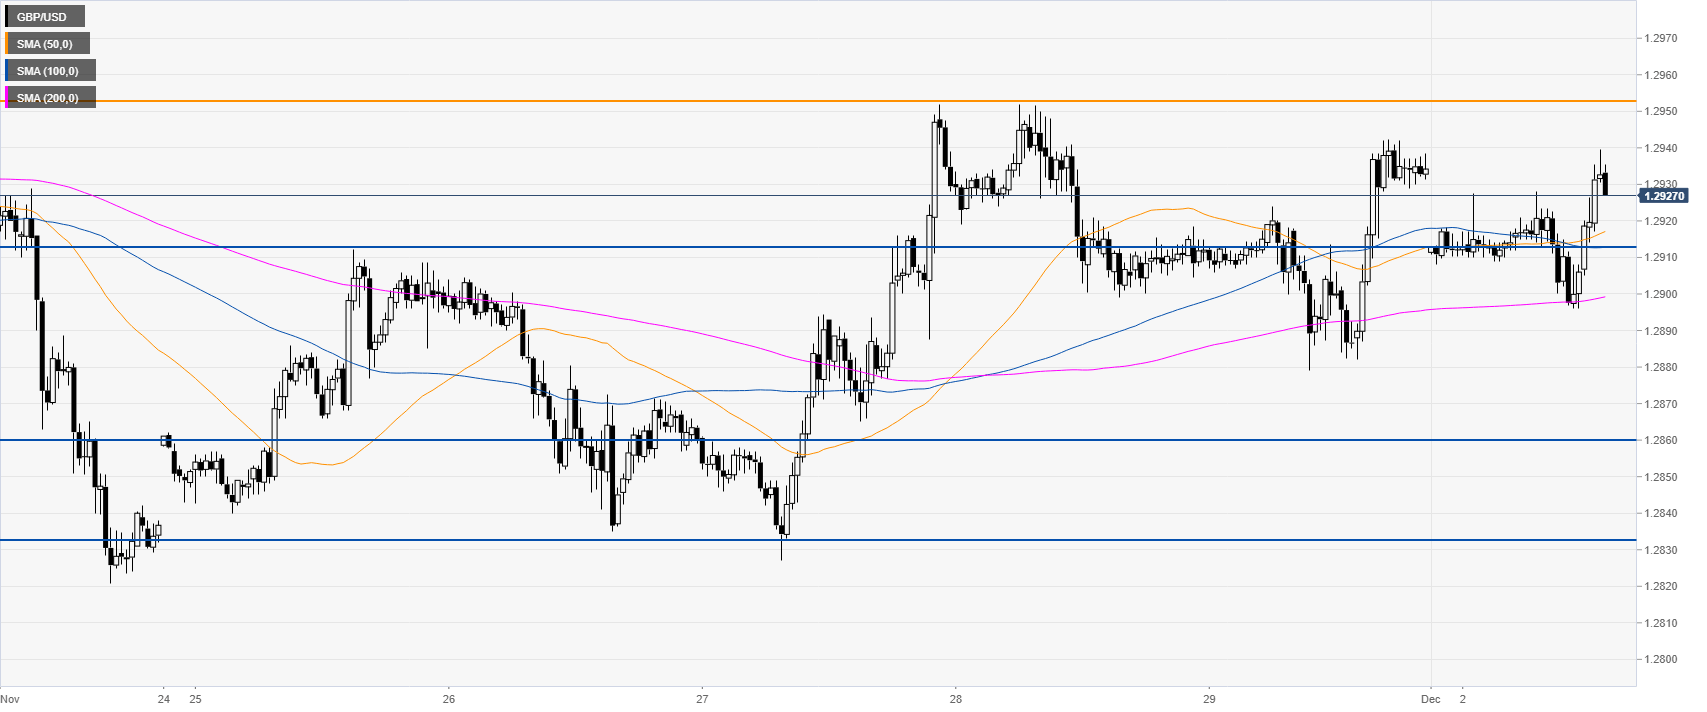
GBP/USD 30-minute chart

 
GBP/USD closed the Sunday opening gap while challenging the daily high. Immediate support is seen at the 1.2913 level. Further down lie the 1.2860 and 1.2832 price levels.
  

Additional key levels

GBP/USD

Overview
Today last price1.2931
Today Daily Change-0.0003
Today Daily Change %-0.02
Today daily open1.2934
 
Trends
Daily SMA201.2881
Daily SMA501.2718
Daily SMA1001.2497
Daily SMA2001.2701
 
Levels
Previous Daily High1.2942
Previous Daily Low1.2879
Previous Weekly High1.2952
Previous Weekly Low1.2827
Previous Monthly High1.2986
Previous Monthly Low1.2769
Daily Fibonacci 38.2%1.2918
Daily Fibonacci 61.8%1.2903
Daily Pivot Point S11.2895
Daily Pivot Point S21.2855
Daily Pivot Point S31.2831
Daily Pivot Point R11.2958
Daily Pivot Point R21.2982
Daily Pivot Point R31.3021

Author

Flavio Tosti

Flavio Tosti

Independent Analyst


More from Flavio Tosti
Share:

Editor's Picks

EUR/USD breaks below 1.1800, two-week lows

EUR/USD’s selling pressure is gathering pace now, breaching below the key 1.1800 yardstick to hit new two-week troughs on Wednesday. The pair’s pullback comes on the back of marked gains in the US Dollar following US data releases and ahead of the publication of the FOMC Minutes.

GBP/USD reaches multi-day lows near 1.3500

GBP/USD reverses its initial upside momentum and is now adding to previous declines, approaching the 1.3500 region on Wednesday. Cable’s downtick comes on the back of decent gains in the Greenback and easing UK inflation figures, which seem to have reinforced the case for a BoE rate cut in March.

Gold battle to regain $5,000 continues

Gold is back on the front foot on Wednesday, shaking off part of the early week softness and challenging two-day highs near the $5,000 mark per troy ounce. The move comes ahead of the FOMC Minutes and is unfolding despite an intense rebound in the US Dollar.

Fed Minutes to shed light on January hold decision amid hawkish rate outlook

The Minutes of the Fed’s January 27-28 monetary policy meeting will be published today. Details of discussions on the decision to leave the policy rate unchanged will be scrutinized by investors.

Mixed UK inflation data no gamechanger for the Bank of England

Food inflation plunged in January, but service sector price pressure is proving stickier. We continue to expect Bank of England rate cuts in March and June. The latest UK inflation read is a mixed bag for the Bank of England, but we doubt it drastically changes the odds of a March rate cut.

Sui extends sideways action ahead of Grayscale’s GSUI ETF launch

Sui is extending its downtrend for the second consecutive day, trading at 0.95 at the time of writing on Wednesday. The Layer-1 token is down over 16% in February and approximately 34% from the start of the year, aligning with the overall bearish sentiment across the crypto market.