|

GBP/USD technical analysis: Cable is under pressure below the 1.2230 resistance

  • GBP/USD is off the monthly highs after reaching 1.2310 on Tuesday.
  • The levels to beat for bears are seen at 1.2211, followed by 1.2173 support levels.
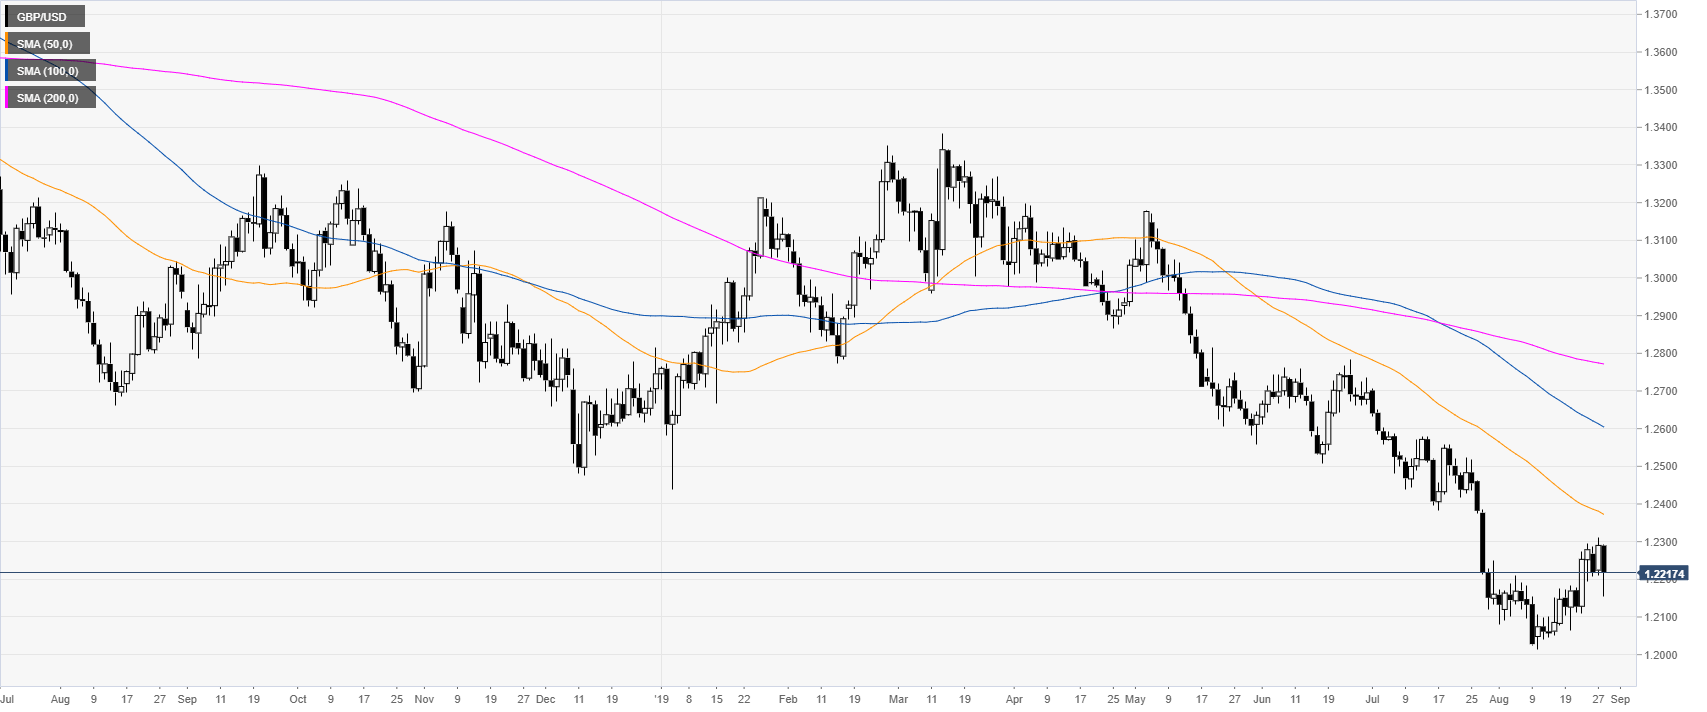
 

GBP/USD daily chart

 
GBP/USD is in a bear trend below the main daily simple moving averages (SMAs). However, in the last two and a half weeks, the Cable has been reversing after printing a 2019 low at the 1.2015 level.

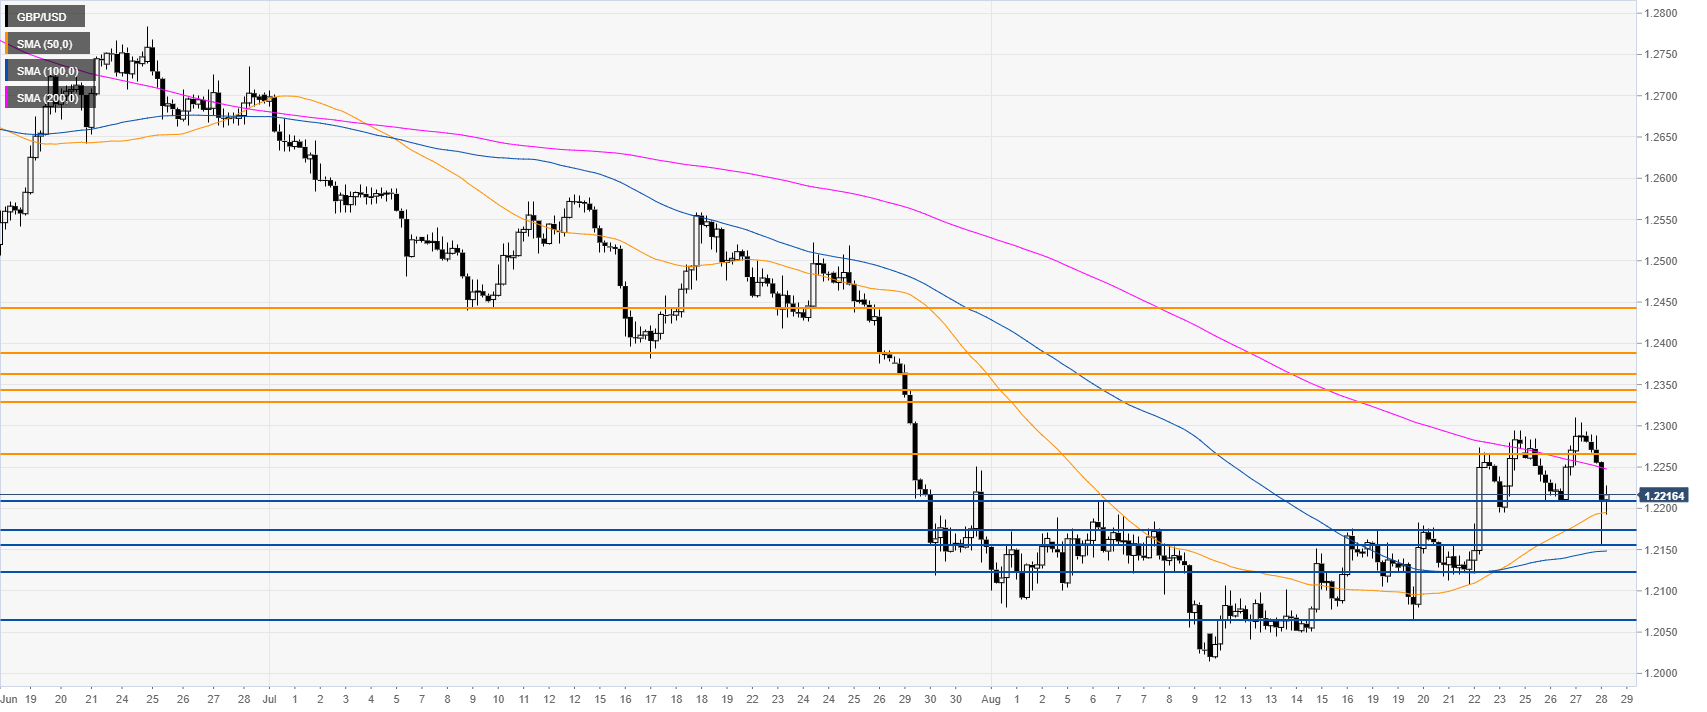
GBP/USD 4-hour chart

 
The Cable broke below the 1.2265 level and the 200 SMA on the 4-hour time frame. The market is now challenging the 1.2211 support and the 50 SMA. If the bears keep the pressure on, they can drive the market towards 1.2173, 1.2122 and 1.2065 levels, according to the Technical Confluences Indicator.
 

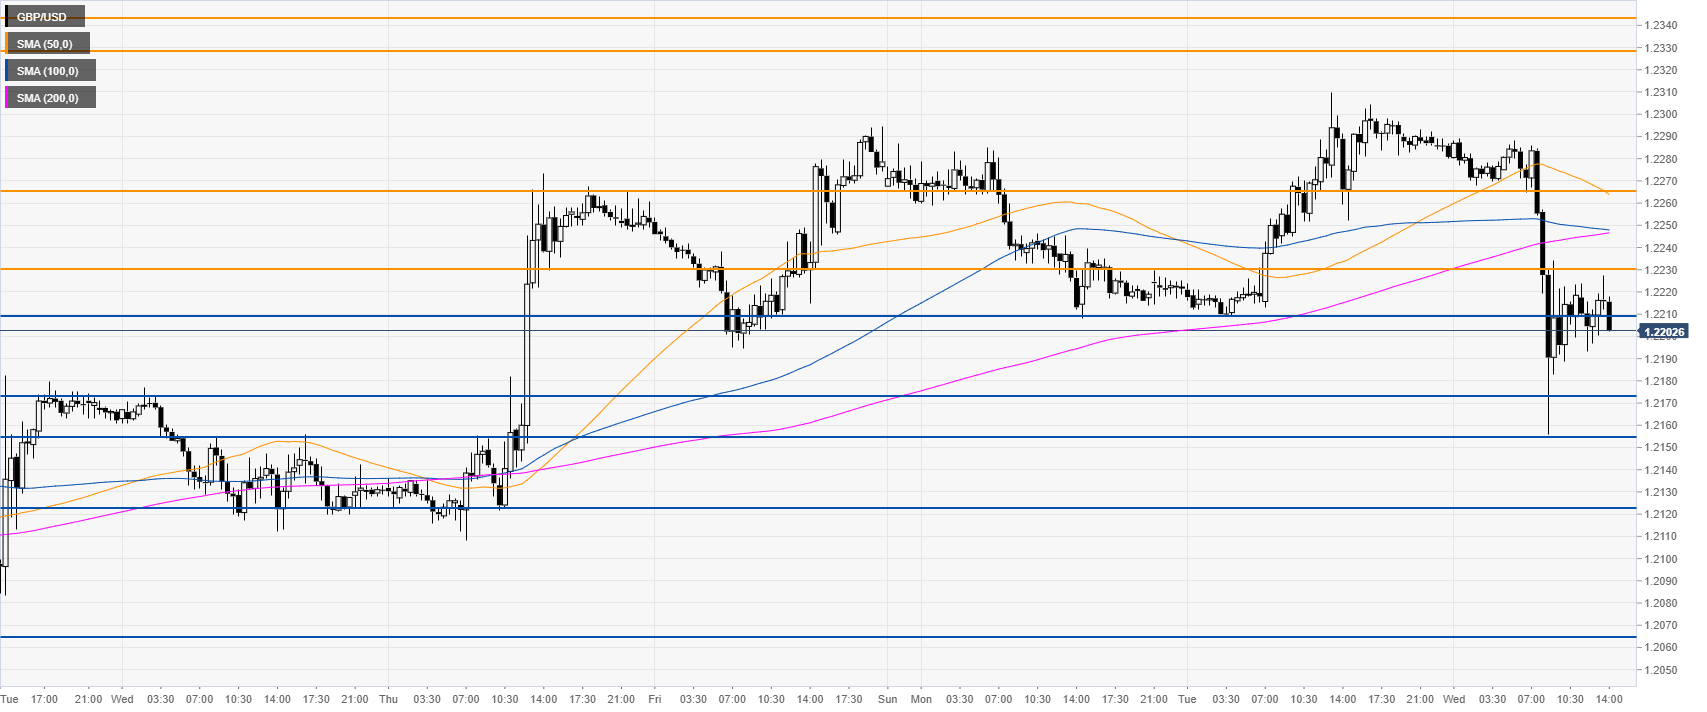
GBP/USD 30-minute chart

 
GBP/USD is trading below its main SMAs, suggesting bearish momentum in the near term. Immediate resistances are seen at 1.2230 and 1.2265 levels, according to the Technical Confluences Indicator.

Additional key levels

GBP/USD

Overview
Today last price1.2216
Today Daily Change-0.0074
Today Daily Change %-0.60
Today daily open1.229
 
Trends
Daily SMA201.2148
Daily SMA501.2381
Daily SMA1001.2613
Daily SMA2001.2774
Levels
Previous Daily High1.231
Previous Daily Low1.2209
Previous Weekly High1.2294
Previous Weekly Low1.2064
Previous Monthly High1.2706
Previous Monthly Low1.2119
Daily Fibonacci 38.2%1.2271
Daily Fibonacci 61.8%1.2248
Daily Pivot Point S11.2229
Daily Pivot Point S21.2169
Daily Pivot Point S31.2128
Daily Pivot Point R11.233
Daily Pivot Point R21.2371
Daily Pivot Point R31.2431

Author

Flavio Tosti

Flavio Tosti

Independent Analyst


More from Flavio Tosti
Share:

Editor's Picks

EUR/USD flirts with daily highs, retargets 1.1900

EUR/USD regains upside traction, returning to the 1.1880 zone and refocusing its attention to the key 1.1900 barrier. The pair’s slight gains comes against the backdrop of a humble decline in the US Dollar as investors continue to assess the latest US CPI readings and the potential Fed’s rate path.

GBP/USD remains well bid around 1.3650

GBP/USD maintains its upside momentum in place, hovering around daily highs near 1.3650 and setting aside part of the recent three-day drop. Cable’s improved sentiment comes on the back of the Greenback’s  irresolute price action, while recent hawkish comments from the BoE’s Pill also collaborate with the uptick.

Gold clings to gains just above $5,000/oz

Gold is reclaiming part of the ground lost on Wednesday’s marked decline, as bargain-hunters keep piling up and lifting prices past the key $5,000 per troy ounce. The precious metal’s move higher is also underpinned by the slight pullback in the US Dollar and declining US Treasury yields across the curve.

Crypto Today: Bitcoin, Ethereum, XRP in choppy price action, weighed down by falling institutional interest 

Bitcoin's upside remains largely constrained amid weak technicals and declining institutional interest. Ethereum trades sideways above $1,900 support with the upside capped below $2,000 amid ETF outflows.

Week ahead – Data blitz, Fed Minutes and RBNZ decision in the spotlight

US GDP and PCE inflation are main highlights, plus the Fed minutes. UK and Japan have busy calendars too with focus on CPI. Flash PMIs for February will also be doing the rounds. RBNZ meets, is unlikely to follow RBA’s hawkish path.

Ripple Price Forecast: XRP potential bottom could be in sight

Ripple edges up above the intraday low of $1.35 at the time of writing on Friday amid mixed price actions across the crypto market. The remittance token failed to hold support at $1.40 the previous day, reflecting risk-off sentiment amid a decline in retail and institutional sentiment.