|

GBP/USD technical analysis: Cable enters the Asian session near the 1.2216 level

  • GBP/USD is ending Monday near its daily low. 
  • The levels to beat for bears are seen at 1.2216, followed by 1.2197 support.
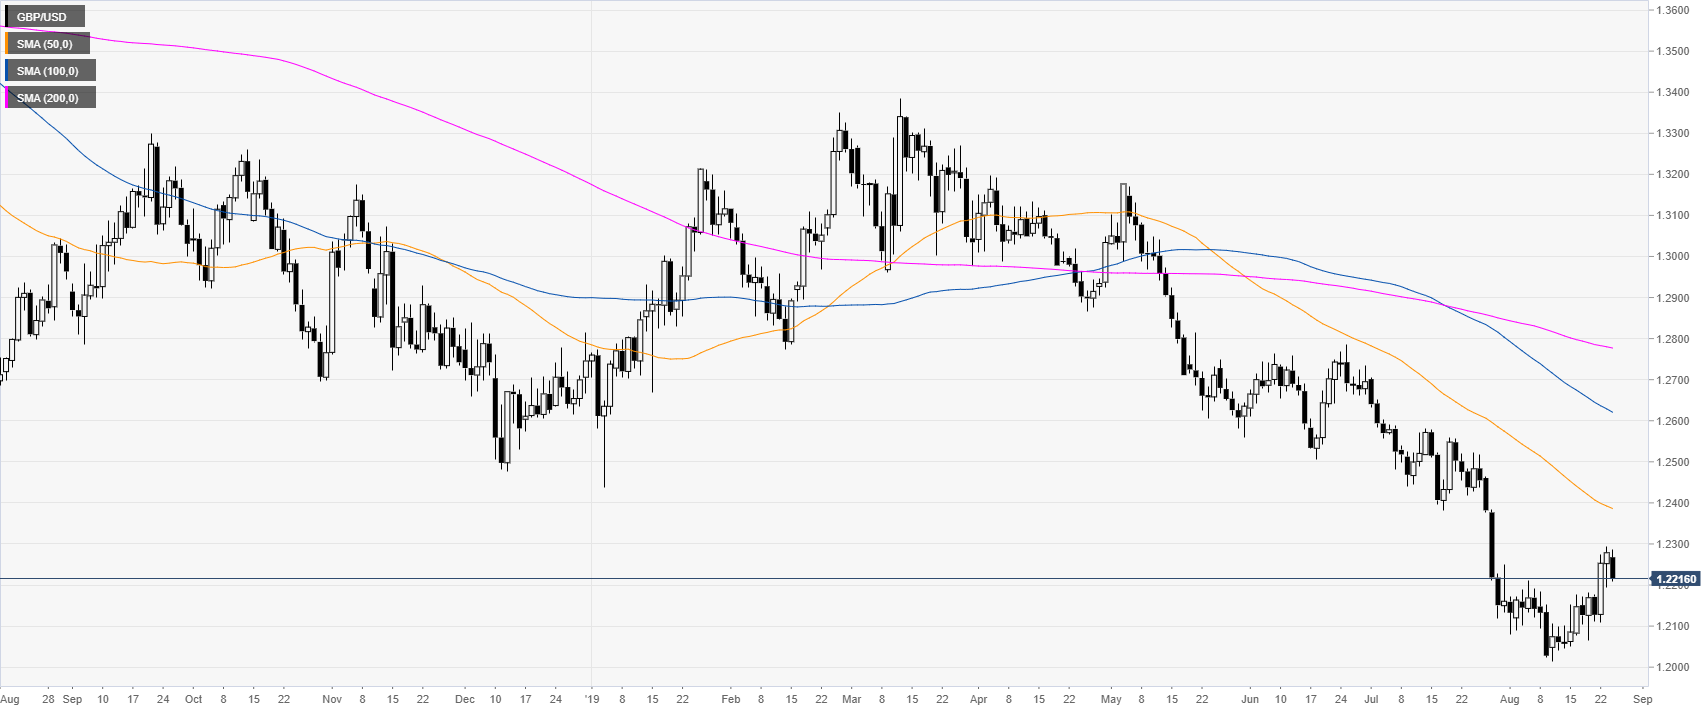
 

GBP/USD daily chart

 
GBP/USD is trading in a bear trend below the main daily simple moving averages (SMAs). This Monday the market is retreating below the 1.2300 figure.

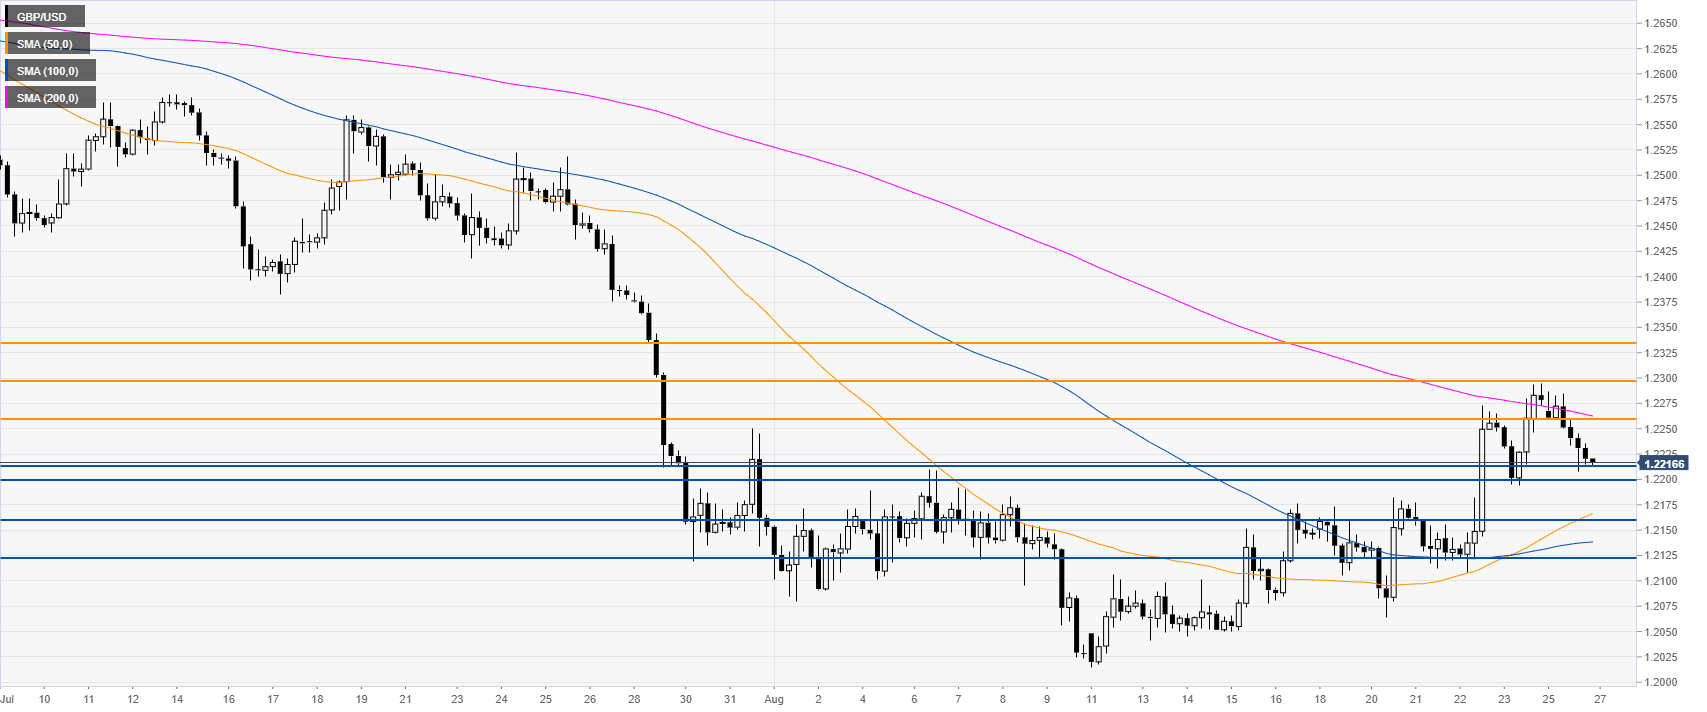
GBP/USD 4-hour chart

 
The Cable is trading below a downward sloping 200 SMA suggesting bearish momentum in the medium term. Sellers need to break below 1.2216 to reach 1.2197, 1.2159 and 1.2121 support on the way down, according to the Technical Confluences Indicator.
  

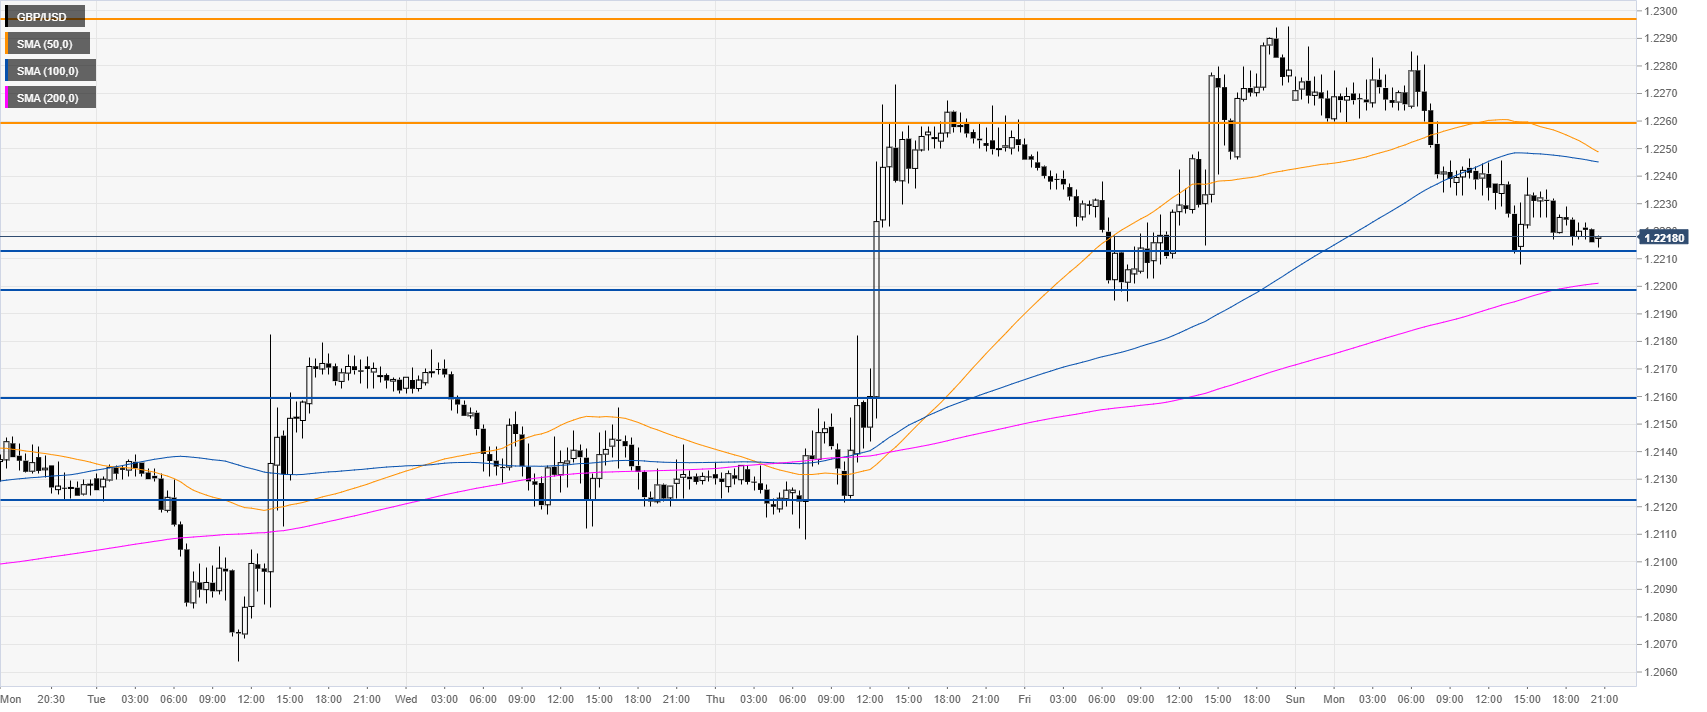
GBP/USD 30-minute chart

 
GBP/USD is trading between the 100 and 200 SMAs, suggesting a consolidation in the short term. Resistances are seen at 1.2261, 1.2300 and the 1.2330 levels.

Additional key levels

GBP/USD

Overview
Today last price1.2217
Today Daily Change-0.0062
Today Daily Change %-0.50
Today daily open1.2279
 
Trends
Daily SMA201.2141
Daily SMA501.2392
Daily SMA1001.2629
Daily SMA2001.278
Levels
Previous Daily High1.2294
Previous Daily Low1.2194
Previous Weekly High1.2294
Previous Weekly Low1.2064
Previous Monthly High1.2706
Previous Monthly Low1.2119
Daily Fibonacci 38.2%1.2256
Daily Fibonacci 61.8%1.2233
Daily Pivot Point S11.2217
Daily Pivot Point S21.2156
Daily Pivot Point S31.2117
Daily Pivot Point R11.2317
Daily Pivot Point R21.2356
Daily Pivot Point R31.2417

Author

Flavio Tosti

Flavio Tosti

Independent Analyst


More from Flavio Tosti
Share:

Editor's Picks

EUR/USD hovers around nine-day EMA above 1.1800

EUR/USD gains ground for the second successive session, trading around 1.1820 during the Asian hours on Monday. The 14-day Relative Strength Index momentum indicator stands at 51 (neutral) after recovering above the midline, indicating stabilizing momentum. 

GBP/USD gathers strength above 1.3500 amid tariff confusion

The GBP/USD pair gains traction to around 1.3520 during the early Asian session on Monday. The US Dollar faces some selling pressure against the Cable as tariff uncertainty lingers. Traders will take more cues from the US Producer Price Index report for January, which will be published later on Friday. 

Gold climbs to fresh monthly high on trade war fears, geopolitical risks, weaker USD

Gold registered its highest-ever weekly close, above the $5,100 mark on Friday, and gains strong follow-through traction at the start of a new week. This also marks the fourth straight day of a positive move and lifts the commodity beyond the $5,150 level, or a fresh monthly peak, during the Asian session. 

Cardano braces for impact as US tariff storm brews

Cardano is down 4% at press time on Monday, entering its third consecutive day of decline. Bearish bias in Cardano’s derivatives market positional buildup aligns with rising pressure on the broader cryptocurrencymarket amid US President Donald Trump's reassessment of global tariffs and domestic conflict with the US Supreme Court. 

Liberation day take two, the tariff machine just changed gears

Let me caveat this from the outset. What we are watching is first-order mechanics, not the grand macro endgame. This is the market’s immediate reflex to a 15% Trump tariff levy dressed up as judicial drama. The Supreme Court blocked Trump tarrif hammer. The White House came back with a scalpel.

Top Crypto Losers: Zcash, Pump.fun, and LayerZero extended losses as Bitcoin loses $65,000

The cryptocurrency market starts the week in panic mode, with altcoins Zcash, Pump.fun, and LayerZero. Bitcoin falls below $65,000 as the US President Donald Trump regroups amid renewed trade policy risks.